
Fig. 4.
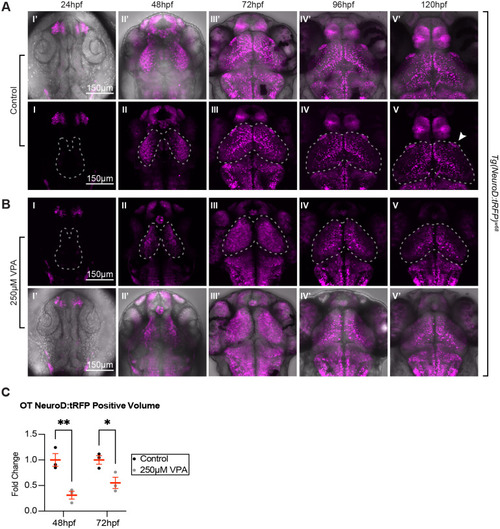
Tg(NeuroD:tRFP)w68 imaging during the first 5 days of development reveals differences in neuronal maturation between control and treated embryos. Similar to Fig. 2, we noticed no appreciable neuronal specification (as assessed by tRFP expression) in control (A I, I′) or treated embryos (B I, I′) at 24 hpf, and more neuronal specification in control (A II, II′) versus treated embryos (B II, II′) at 48 hpf (dashed outlines indicate OT location). As development progressed from 72-120 hpf, tRFP began to be restricted to subsets of neurons in control larvae (A III-V, III′-V′). Instead, in treated larvae, tRFP expression was detected throughout the OT at 72 hpf (B III), which most likely resembles a time point between 48 and 72 hpf in control embryos (not imaged). This expression becomes more restricted at 96-120 hpf (B IV,V,IV′,V′), suggesting that although neuronal specification lags or slows down in treated embryos, it does eventually occur. Whether the OT neurons in treated embryos are specified to become the same subclasses of neurons as in the control embryos remains to be determined. In addition, treated larvae lack expression in arborization field 7 (A F7) (arrow in A V), a pretectal nucleus shown to be involved in hunting behavior, and scattered neuropil expression seen in controls. Panels I′-V′ in both A and B are overlays of fluorescent images on transmitted confocal projections. (C) Quantification of the volume of tRFP positive neurons at 48 hpf and 72 hpf. Since tRFP is localized in the cytoplasm, it wasn't possible to count tRFP positive neurons. Therefore, we quantified the tRFP positive volume of control and treated embryos, and found that the tRFP positive volume is significantly smaller in treated embryos when compared to controls. Although these observations were seen in three different week-long experiments (three embryos per experiment and experimental condition), the quantification was done on three embryos from the same experimental week. Data are shown as mean±s.e.m. A two-way ANOVA with Šidák's multiple comparisons test was used for statistical analysis. *P<0.05, **P<0.01. |