
|
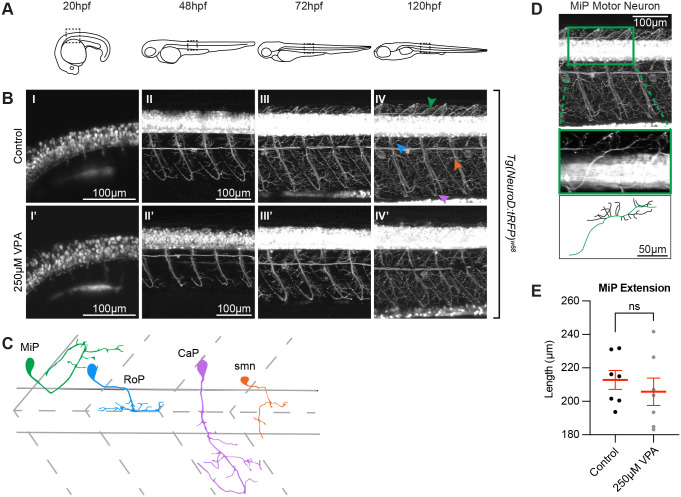
Fig. 6.
VPA effects do not extend to all neurons in the embryo. (A) Schematic of the imaging location at the different time points in embryos and larvae. Images of the spinal cord neurons in the Tg(NeuroD:tRFP)w68 line indicate that neurogenesis (B) is occurring at the same time (∼20 hpf) in control (I) and treated embryos (I′). Moreover, despite being somewhat delayed, axonogenesis and dendritogenesis in treated embryos (II′-IV′) does not look significantly different when compared to controls (II-IV) from 48-120 hpf. (C) Cartoon of MiP, RoP, CaP, and smn motor neurons based on (Myers et al., 1986). Initially we thought that the dorsal projections of MiP motor neurons in the treated larvae were affected. However, when we used Fiji's (ImageJ) SNT macro, to trace the neurons in three dimensions (D), and measure the length of the primary projection (green trace in the cartoon), we found that the differences between control and VPA-treated embryos were not statistically different from one another (E). Two to three MiPs were traced in each embryo and three embryos per condition were analyzed. (Each dot represents one MiP). Data shown as mean±s.e.m. A two-tailed unpaired t-test was used to determine significance. (*) in IV′ indicate pigment spots concealing the structures below. Due to the high fluorescence level in the neuronal cell bodies, gamma has been adjusted (0.60) uniformly on all images in panel B to allow for visualization of neuronal projections.