
Fig. 5.
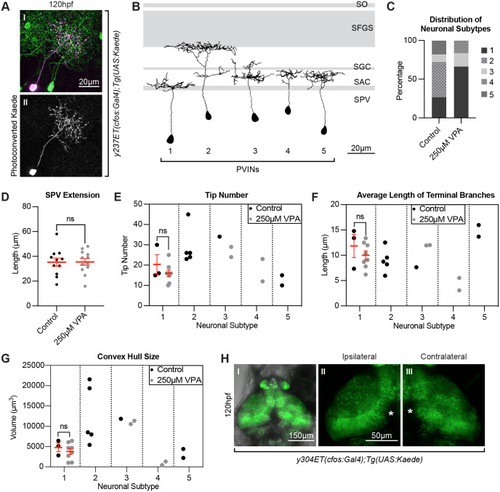
Photoconversions of neurons in the OT of VPA-treated embryos reveal shortened and less complex neuronal projections. (A) Photoconversion of Kaede (II) from green to red (pseudo-colored magenta) (I) was carried out in single neurons in 5 dpf larvae in the y237Et(cfos:Gal4); Tg(UAS:Kaede) line, which labels only a few OT neurons. Eleven neurons from control larvae and twelve neurons from 250μM VPA-treated larvae were photoconverted and traced using the SNT macro, Fiji (ImageJ). (B) The presence of five different periventricular interneuron (PVIN) subtypes which extend projections in different layers of the neuropil were detected. Panel based on (Nevin et al., 2010) with OT retinoreceptive laminae shown in gray. SPV: stratum periventriculare; SAC: stratum album centrale; SGC: stratum griseum centrale; SFGS: stratum fibrosum et griseum superficiale; SO: stratum opticum. (C) Most of the photoconverted neurons in control larvae were of subtype 2 [which extend their projections to the more distal laminae SFGS (n=5)] and subtype 1 (n=3), fewer of subtype 5 (n=2) and subtype 3 (n=1), with no subtype 4 neurons. In the treated larvae, most of the neurons were of subtype 1 (n=8) and few of subtype 3 (n=2) and subtype 4 (n=2), with no subtype 2 or subtype 5 neurons. (D) The distance of the photoconverted PVIN cell bodies to the start of the neuropil, on the other hand, was not different between control and treated larvae. All neuronal subtypes were combined for this analysis (control n=11) (250 µM VPA, n=12). Data are shown as mean±s.e.m. A two-tailed unpaired t-test was used to determine significance. *P<0.05, **P<0.01, ***P<0.001. Using SNT macro, Fiji (ImageJ), on the traced neurons for each neuronal subtype in control and treated conditions, we calculated the tip number (E), average length of terminal branches (F), and convex hull size (G), which indicates the total volume of the arborization field. Since we did not have enough neurons representing each subtype in control and treated conditions, we only compared these parameters in subtype 1 neurons and found them to be not statistically different from one another. (Each dot represents one neuron). Data shown as mean±s.e.m. A two-tailed unpaired t-test with Welch's correction was used to determine significance ***P<0.001. (H I) Unilateral enucleations (eye removals) (left), show that both ipsilateral (H II) and contralateral (H III) OT neuropils are identical to each other, indicating that the status of retinotectal axons is not integral to the initial development of OT neuron projections. This suggests that VPA effects on the OT are not due to possible VPA effects on retinotectal projections from the retina, as seen in other studies (Cowden et al., 2012). (H II and H III) zoomed in views of H I. * in H II and H III indicate pigment spots concealing the structures below. |