FIGURE SUMMARY
Title

ST3GAL5-catalyzed gangliosides inhibit TGF-β-induced epithelial-mesenchymal transition via TβRI degradation

Authors
Zhang, J., van der Zon, G., Ma, J., Mei, H., Cabukusta, B., Agaser, C.C., Madunić, K., Wuhrer, M., Zhang, T., Ten Dijke, P.
Source
Full text @ EMBO J.

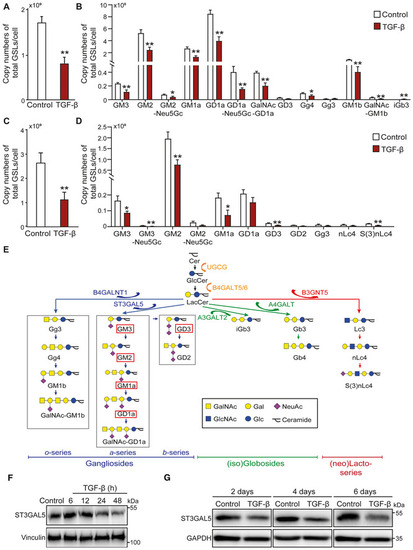
TGF‐β decreases the abundance of glycosphingolipid (GSL)‐glycans

  • A, B
    Average copy numbers of (A) total GSL‐glycans and (B) individual GSL‐glycans per cell in NMuMG cells stimulated with TGF‐β.
  • C, D
    Average copy numbers of (C) total GSL‐glycans and (D) individual GSL‐glycans per cell in A549‐VIM‐RFP cells treated with TGF‐β.
  • E
    GSL biosynthesis scheme. GSLs present in both NMuMG cells, and A549‐VIM‐RFP cells are highlighted by red boxes.
  • F, G
    Immunoblot analysis of ST3GAL5 in (F) NMuMG and (G) A549‐VIM‐RFP cells treated with vehicle control or TGF‐β for the indicated time. Vinculin and GAPDH: loading controls.

Data information: Unless stated otherwise, TGF‐β (2.5 ng/ml) and vehicle control were applied for 48 h. The histograms show the mean ± SD values from three biological replicates (n = 3). *P ≤ 0.05; **P < 0.01 based on unpaired Student's t‐test. GT1b: internal normalization control.

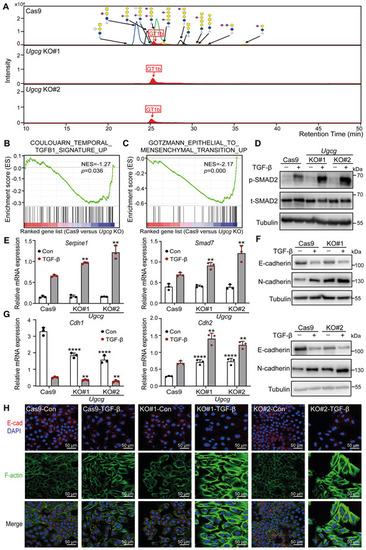
KO of Ugcg, a key enzyme in the biosynthesis of GSLs, promotes TGF‐β signaling and TGF‐β‐induced EMT in NMuMG cells

  1. Combined extracted ion chromatography of GSL glycans in Ugcg KO and control NMuMG cells. GT1b: internal normalization control.
  2. Mouse TGF‐β gene signatures were enriched in Cas9 control versus Ugcg KO NMuMG cells, as shown by GSEA. Normalized enrichment score (NES) = −1.27, P = 0.036.
  3. GSEA of mouse EMT gene signatures in Cas9 control versus Ugcg KO NMuMG cells. NES = −2.17, P = 0.000.
  4. Immunoblot analysis of p‐SMAD2 and total SMAD2 (t‐SMAD2) in NMuMG cells with or without Ugcg deficiency and treated with vehicle control or TGF‐β for 1 h. Tubulin: loading control.
  5. qRT–PCR analysis of TGF‐β target genes, including Serpine1 and Smad7, in Ugcg KO NMuMG or control NMuMG cells treated with vehicle control or TGF‐β for 6 h.
  6. Immunoblot analysis of E‐cadherin and N‐cadherin in Ugcg KO NMuMG or control NMuMG cells treated with vehicle control or TGF‐β for 48 h. Tubulin: loading control.
  7. Cdh1 and Cdh2 mRNA levels in Ugcg KO or control NMuMG cells after vehicle control or TGF‐β treatment for 48 h.
  8. Immunofluorescence analysis of the expression and localization of E‐cadherin (red) and the formation of F‐actin (green) after treatment with vehicle control or TGF‐β for 2 days. Nuclei were counterstained with DAPI (blue). Images were acquired with confocal microscopy. Scale bar = 50 μm.

Data information: TGF‐β was applied at a final concentration of 2.5 ng/ml. In (E, G), the data are expressed as the mean ± SD values from three biological replicates (n = 3). **P < 0.01; ****P < 0.0001 based on unpaired Student's t‐test.

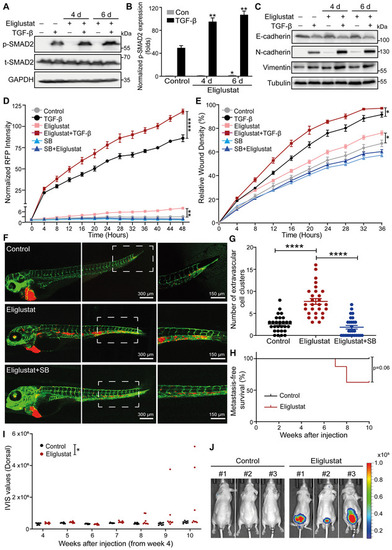
Eliglustat, a UGCG inhibitor, enhances TGF‐β signaling and TGF‐β‐induced EMT, migration, extravasation and early metastatic outgrowth of A549 cells

  1. Immunoblot analysis of p‐SMAD and t‐SMAD2 in A549‐VIM‐RFP cells pretreated with eliglustat for 4 or 6 days and then treated with vehicle control or TGF‐β for 1 h. GAPDH: loading control.
  2. Quantification of the p‐SMAD2 level in A549‐VIM‐RFP cells as shown in (A). The levels were normalized to that of GAPDH, and fold changes were then further normalized to the level of p‐SMAD2 in control cells without TGF‐β treatment.
  3. Immunoblot analysis of the epithelial marker E‐cadherin and mesenchymal markers N‐cadherin and vimentin in A549‐VIM‐RFP cells treated with eliglustat for 4 or 6 days and/or with vehicle control and/or TGF‐β for 2 days. Tubulin: loading control.
  4. Effect of eliglustat (pre)treatment for 4 days on vimentin expression in A549‐VIM‐RFP cells in response to TGF‐β and/or SB505124 (SB, 1 μM) treatment for the indicated times. The time course of RFP‐tagged vimentin expression was monitored with IncuCyte. The red object intensity was normalized to the red intensity at 0 h.
  5. A549‐VIM‐RFP cells were pretreated with eliglustat for 4 days and were then incubated with TGF‐β or SB505124 (SB, 1 μM) for the indicated times. The real‐time scratch assay results were analyzed with an IncuCyte system.
  6. mCherry‐labeled A549 cells were pretreated with eliglustat (2 μM) for 4 days and were then injected into ducts of Cuvier of zebrafish embryos. Representative images with magnified regions (outlined with dotted squares) of extravasated cells were acquired 4 days after injection by confocal microscopy. SB group zebrafish were treated with the inhibitor SB505124 (1 μM) in the egg water together with eliglustat for 4 days after injection with daily refreshment of the treatments. Scale bar = 300 or 150 μm.
  7. Quantification of the number of extravasated cell clusters from 28 embryos per group. ****P < 0.0001 based on unpaired Student's t‐test from two biological replicates (n = 2).
  8. Kaplan–Meier analysis of metastasis‐free survival in eight mice in the group injected with untreated A549‐Luc cells and eight mice injected with cells pretreated with eliglustat for 1 week. The log‐rank test was used for statistical analysis; P = 0.06.
  9. Analysis of the in vivo imaging system (IVIS) values from the fourth week post‐injection in eight mice in the control group and eight mice in the eliglustat pretreatment group.
  10. Whole‐body bioluminescence images (BLI) at 10 weeks of three mice injected with untreated A549‐Luc cells or cells pretreated with eliglustat for 1 week. BLI of all eight mice in each group are shown in Appendix Fig S4E.

Data information: TGF‐β and eliglustat were applied at final concentrations of 2.5 ng/ml and 2 μM, respectively. All data are expressed as the mean ± SD values from three biological replicates (n = 3). *P ≤ 0.05; **P < 0.01; ****P < 0.0001. In (B, D, E), statistical analysis was based on two‐way ANOVA.

Inhibition of GSL biosynthesis decreases the TβRI level in lipid rafts and inhibits the ubiquitination and degradation of TβRI

  1. Lysates from NMuMG control cells (Cas9‐expressing cells) and Ugcg KO cells were subjected to sucrose density gradient ultracentrifugation. The expression levels of flotillin‐1, β1‐integrin, EEA1, and TβRI in the sucrose gradient fractions were analyzed by immunoblotting. Fractions 3, 4, and 5 contained lipid rafts, whereas fractions 10–12 corresponded to the non‐lipid raft fractions.
  2. Quantification of TβRI percentages in lipid raft and non‐lipid raft fractions from Ugcg KO NMuMG and control cells.
  3. Isolation of lipid rafts from other cellular components in A549‐VIM‐RFP cells treated with the UGCG inhibitor eliglustat (2 μM) for 6 days using sucrose density gradient ultracentrifugation and measurement of flotillin‐1, β1‐integrin, EEA1, and TβRI levels in the sucrose gradient fractions using immunoblot analysis. Fractions 3–6 contained lipid rafts, whereas fractions 10–12 corresponded to the non‐lipid raft fractions.
  4. Quantification of TβRI percentages in lipid raft and non‐lipid raft fractions from A549‐VIM‐RFP cells treated with eliglustat (2 μM) for 6 days.
  5. Ubiquitination of TβRI was detected by immunoprecipitation (IP) of Myc‐tagged caTβRI from HA‐Ub‐transfected HEK293T cells with or without eliglustat (2 μM) treatment for 6 days. All groups were treated with MG132 (5 μM) for 6 h.
  6. Immunoblot analysis of TβRI expression levels in control and eliglustat (2 μM)‐treated A549‐VIM‐RFP cells treated with 50 μg/ml CHX for the indicated times. Vinculin: loading control.
  7. Quantification of TβRI expression levels with normalization to the t = 0 controls.

Data information: In (B, D), the data are expressed as the mean ± SD values from two biological replicates (n = 2). In (G), the data are expressed as the means ± SD values from three biological replicates (n = 3). *P ≤ 0.05; **P < 0.01; ****P < 0.0001 based on unpaired Student's t‐test.

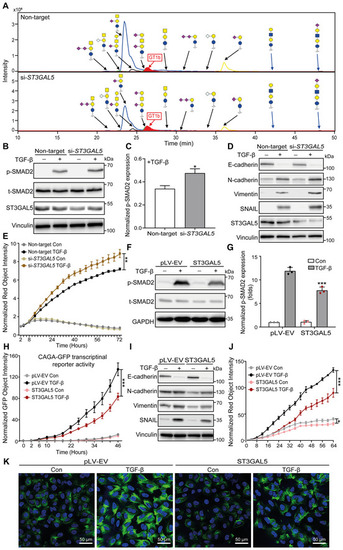
ST3GAL5 inhibits TGF‐β signaling and TGF‐β‐induced EMT

  1. Extracted ion chromatograms of GSL‐glycans released from A549‐VIM‐RFP cells transfected with nontargeting, ST3GAL5 or B4GALNT1 siRNA. GT1b: internal normalization control.
  2. Immunoblot analysis of p‐SMAD2, t‐SMAD2, and ST3GAL5 in A549‐VIM‐RFP cells with siRNA‐mediated ST3GAL5 knockdown or transfection of nontargeting siRNA and treated with vehicle control or TGF‐β for 1 h. Vinculin: loading control.
  3. Quantification of the p‐SMAD2 level in A549‐VIM‐RFP cells transfected with nontargeting or ST3GAL5 siRNA and treated with TGF‐β as shown in (B).
  4. Expression levels of ST3GAL5, the epithelial marker E‐cadherin, and mesenchymal markers, including N‐cadherin, vimentin, and SNAIL, in siRNA ST3GAL5‐depleted and nontargeting siRNA‐transfected A549‐VIM‐RFP cells treated with vehicle control or TGF‐β for 48 h. Vinculin: loading control.
  5. The time course of RFP‐tagged vimentin expression was monitored with an IncuCyte system in siRNA ST3GAL5 knockdown and nontargeting siRNA‐transfected A549‐VIM‐RFP cells treated with vehicle control or TGF‐β for the indicated times. The red object intensity was normalized to the red intensity at 0 h.
  6. Immunoblot analysis of p‐SMAD2 and t‐SMAD2 in A549‐VIM‐RFP cells transduced with empty vector (pLV‐EV) or the ST3GAL5 expression construct and stimulated with vehicle control or TGF‐β for 1 h. GAPDH: loading control.
  7. Quantification of the p‐SMAD2 level in A549‐VIM‐RFP cells transduced with pLV‐EV or the ST3GAL5 overexpression construct and treated with TGF‐β, as shown in (F).
  8. A549‐VIM‐RFP cells transduced with the CAGA‐GFP lentiviral vector and with the pLV‐EV control or ST3GAL5 expression construct were treated with vehicle control or TGF‐β for the indicated times. SMAD3/SMAD4‐dependent (CAGA)12‐mediated transcriptional GFP reporter expression levels were monitored with an IncuCyte system. The GFP object intensity was normalized to the green intensity at 0 h.
  9. Immunoblot analysis of the epithelial marker E‐cadherin and mesenchymal markers, including N‐cadherin, vimentin, and SNAIL, in A549‐VIM‐RFP cells transduced with the pLV‐EV control or ST3GAL5 expression construct and treated with vehicle control or TGF‐β for 48 h. GAPDH: loading control.
  10. Real‐time expression of RFP‐tagged vimentin was monitored with an IncuCyte system in A549‐VIM‐RFP cells transduced with pLV‐EV or the ST3GAL5 expression construct and treated with vehicle control or TGF‐β for the indicated times. The red object intensity was normalized to the red intensity at 0 h.
  11. Alexa Fluor 488 phalloidin staining of F‐actin (green) in pLV‐EV control‐ or ST3GAL5‐expressing A549‐VIM‐RFP cells after stimulation with vehicle control or TGF‐β for 48 h. Nuclei were counterstained with DAPI (blue). Images were acquired with confocal microscopy. Scale bar = 50 μm.

Data information: TGF‐β was applied at a final concentration of 2.5 ng/ml. In (C, E, G, H, J), the data are expressed as the mean ± SD values from three biological replicates (n = 3). *P ≤ 0.05; **P < 0.01; ***P < 0.001. In (C), statistical analysis was based on unpaired Student's t‐test. In (E, G, H, J), statistical analysis was based on two‐way ANOVA.

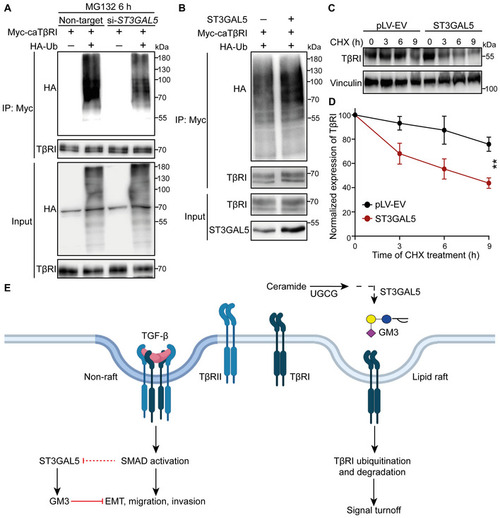
ST3GAL5 promotes TβRI ubiquitination and degradation

  1. HEK293T cells transfected with Myc‐tagged caTβRI, (HA‐Ub, and nontargeting siRNA or ST3GAL5 siRNA were collected for IP with an anti‐Myc antibody and immunoblot analysis. All groups were treated with MG132 (5 μM) for 6 h.
  2. Ubiquitination of TβRI was detected by IP of Myc‐tagged caTβRI from HA‐Ub‐transfected HEK293T cells with or without ST3GAL5 overexpression. All groups were treated with MG132 (5 μM) for 6 h.
  3. Western blot analysis of TβRI expression in A549‐VIM‐RFP cells transduced with the pLV‐EV control or ST3GAL5 expression construct and treated with CHX for the indicated times. Vinculin: loading control.
  4. Quantification of TβRI expression in pLV‐EV control‐ and ST3GAL5‐expressing A549‐VIM‐RFP cells. The results were normalized to the t = 0 controls. The data are shown as the mean ± SD of three independent experiments. **P < 0.01 based on two‐way ANOVA.
  5. Working model for UGCG–ST3GAL5–GM3‐mediated inhibition of TGF‐β signaling via induction of TβRI localization in lipid rafts. The dashed arrow indicates that the SMAD activation‐induced decrease in ST3GAL5 expression has not been formally shown.

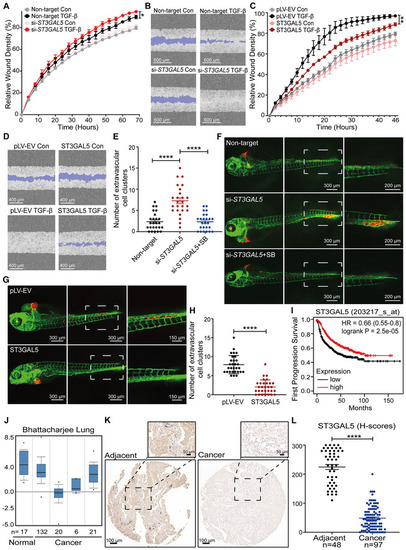
ST3GAL5 inhibits A549 cell migration and invasion, and its expression is associated with good prognosis in lung cancer

  1. Real‐time scratch assay results were analyzed by an IncuCyte system in ST3GAL5 siRNA‐depleted or nontargeting siRNA‐transfected A549‐VIM‐RFP cells treated with vehicle control or TGF‐β (2.5 ng/ml) for the indicated times. The relative wound density (closure) values are presented as the means ± SD values from three biological replicates (n = 3). *P ≤ 0.05 based on two‐way ANOVA.
  2. Representative images of a scratch wound at the final time point (68 h) in nontargeting siRNA‐transfected and ST3GAL5 siRNA knockdown A549‐VIM‐RFP cells treated with vehicle control or TGF‐β (2.5 ng/ml). The region of the original scratch is indicated in purple. Scale bar = 600 μm.
  3. The time course of wound closure was analyzed by an IncuCyte system in A549‐VIM‐RFP cells transduced with the pLV‐EV control or ST3GAL5 expression construct and treated with vehicle control or TGF‐β (2.5 ng/ml) for the indicated times. The relative wound density (closure) values are presented as the means ± SD values from three biological replicates (n = 3). **P < 0.01 based on two‐way ANOVA.
  4. Representative images of a scratch wound at the 46 h time point in A549‐VIM‐RFP cells transduced with the pLV‐EV control or ST3GAL5 ectopic expression construct. The original scratch region is indicated in purple. Scale bar = 400 μm.
  5. mCherry‐labeled A549 cells with ST3GAL5 siRNA depletion or transfection of nontargeting control siRNA were injected into ducts of Cuvier of zebrafish embryos. Zebrafish embryos in the SB group were treated with the inhibitor SB505124 (1 μM) in the egg water for 4 days after injection with daily refreshment of the treatment. The number of extravasated cell clusters was quantified in 25 embryos per group. ****P < 0.0001 based on unpaired Student's t‐test, n = 2.
  6. Representative images with magnified regions (outlined with dotted squares) of extravasated A549 cells in the indicated groups were acquired 4 days after injection by confocal microscopy. Scale bar = 300 or 200 μm.
  7. In vivo zebrafish extravasation experiments with mCherry‐labeled A549 cells with or without ectopic expression of ST3GAL5. Representative images with magnified regions (outlined with dotted squares) of extravasated cells were acquired 4 days after injection by confocal microscopy. Scale bar = 300 or 150 μm.
  8. The number of extravasated cell clusters was quantified in 30 embryos injected with A549 cells transduced with the pLV‐EV control or ST3GAL5 expression construct. ****P < 0.0001 based on unpaired Student's t‐test, n = 2.
  9. Kaplan–Meier survival curves showing the first progression survival of lung cancer patients in a publicly available lung cancer dataset according to ST3GAL5 expression (n = 982).
  10. Box plots of ST3GAL5 gene expression levels in lung cancer tissues and normal tissues in the Bhattacharjee Lung database. The central bands indicate the medium expression values of ST3GAL5, boxes indicate the expression level ranges of ST3GAL5. Data are presented as the means ± SDs from the indicated number of tissues.
  11. Representative images of ST3GAL5 immunohistochemistry in a human lung tissue microarray including normal and cancer tissues. Wide field and magnified images (outlined with dotted squares) are shown. Scale bar = 100 μm.
  12. Scatter plot showing the expression of ST3GAL5 in normal and cancerous lung tissues. Each point represents the H‐score of a single tissue sample with ST3GAL5 staining ranging from completely absent (H‐score 0) to very strong (H‐score 300). H‐scores are presented as the means ± SDs; normal tissues, n = 48; cancer tissues, n = 97; ****P < 0.0001 based on unpaired Student's t‐test.

Acknowledgments
This image is the copyrighted work of the attributed author or publisher, and ZFIN has permission only to display this image to its users. Additional permissions should be obtained from the applicable author or publisher of the image. Full text @ EMBO J.