
Image
|
Figure Caption
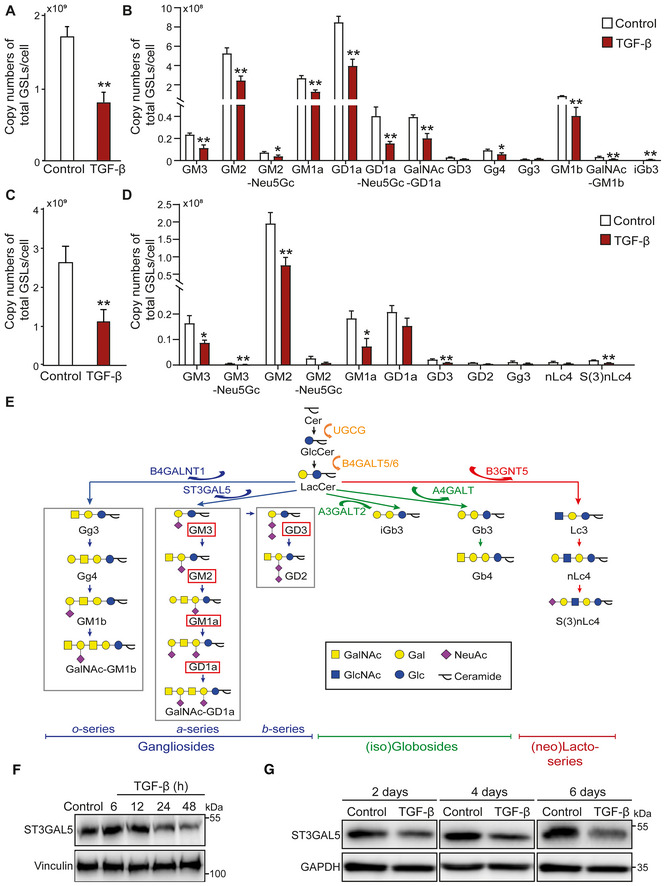
Fig. 1
TGF‐β decreases the abundance of glycosphingolipid (GSL)‐glycans
- A, BAverage copy numbers of (A) total GSL‐glycans and (B) individual GSL‐glycans per cell in NMuMG cells stimulated with TGF‐β.
- C, DAverage copy numbers of (C) total GSL‐glycans and (D) individual GSL‐glycans per cell in A549‐VIM‐RFP cells treated with TGF‐β.
- EGSL biosynthesis scheme. GSLs present in both NMuMG cells, and A549‐VIM‐RFP cells are highlighted by red boxes.
- F, GImmunoblot analysis of ST3GAL5 in (F) NMuMG and (G) A549‐VIM‐RFP cells treated with vehicle control or TGF‐β for the indicated time. Vinculin and GAPDH: loading controls.
Data information: Unless stated otherwise, TGF‐β (2.5 ng/ml) and vehicle control were applied for 48 h. The histograms show the mean ± SD values from three biological replicates (n = 3). *P ≤ 0.05; **P < 0.01 based on unpaired Student's t‐test. GT1b: internal normalization control.
Acknowledgments
This image is the copyrighted work of the attributed author or publisher, and
ZFIN has permission only to display this image to its users.
Additional permissions should be obtained from the applicable author or publisher of the image.
Full text @ EMBO J.