FIGURE

Fig. 3

ID
ZDB-FIG-230622-41
Publication
Zhang et al., 2022 - ST3GAL5-catalyzed gangliosides inhibit TGF-β-induced epithelial-mesenchymal transition via TβRI degradation
Other Figures
All Figure Page
Back to All Figure Page
Fig. 3

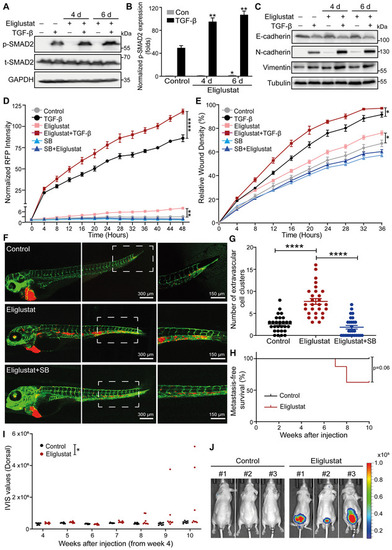
Eliglustat, a UGCG inhibitor, enhances TGF‐β signaling and TGF‐β‐induced EMT, migration, extravasation and early metastatic outgrowth of A549 cells

  1. Immunoblot analysis of p‐SMAD and t‐SMAD2 in A549‐VIM‐RFP cells pretreated with eliglustat for 4 or 6 days and then treated with vehicle control or TGF‐β for 1 h. GAPDH: loading control.
  2. Quantification of the p‐SMAD2 level in A549‐VIM‐RFP cells as shown in (A). The levels were normalized to that of GAPDH, and fold changes were then further normalized to the level of p‐SMAD2 in control cells without TGF‐β treatment.
  3. Immunoblot analysis of the epithelial marker E‐cadherin and mesenchymal markers N‐cadherin and vimentin in A549‐VIM‐RFP cells treated with eliglustat for 4 or 6 days and/or with vehicle control and/or TGF‐β for 2 days. Tubulin: loading control.
  4. Effect of eliglustat (pre)treatment for 4 days on vimentin expression in A549‐VIM‐RFP cells in response to TGF‐β and/or SB505124 (SB, 1 μM) treatment for the indicated times. The time course of RFP‐tagged vimentin expression was monitored with IncuCyte. The red object intensity was normalized to the red intensity at 0 h.
  5. A549‐VIM‐RFP cells were pretreated with eliglustat for 4 days and were then incubated with TGF‐β or SB505124 (SB, 1 μM) for the indicated times. The real‐time scratch assay results were analyzed with an IncuCyte system.
  6. mCherry‐labeled A549 cells were pretreated with eliglustat (2 μM) for 4 days and were then injected into ducts of Cuvier of zebrafish embryos. Representative images with magnified regions (outlined with dotted squares) of extravasated cells were acquired 4 days after injection by confocal microscopy. SB group zebrafish were treated with the inhibitor SB505124 (1 μM) in the egg water together with eliglustat for 4 days after injection with daily refreshment of the treatments. Scale bar = 300 or 150 μm.
  7. Quantification of the number of extravasated cell clusters from 28 embryos per group. ****P < 0.0001 based on unpaired Student's t‐test from two biological replicates (n = 2).
  8. Kaplan–Meier analysis of metastasis‐free survival in eight mice in the group injected with untreated A549‐Luc cells and eight mice injected with cells pretreated with eliglustat for 1 week. The log‐rank test was used for statistical analysis; P = 0.06.
  9. Analysis of the in vivo imaging system (IVIS) values from the fourth week post‐injection in eight mice in the control group and eight mice in the eliglustat pretreatment group.
  10. Whole‐body bioluminescence images (BLI) at 10 weeks of three mice injected with untreated A549‐Luc cells or cells pretreated with eliglustat for 1 week. BLI of all eight mice in each group are shown in Appendix Fig S4E.

Data information: TGF‐β and eliglustat were applied at final concentrations of 2.5 ng/ml and 2 μM, respectively. All data are expressed as the mean ± SD values from three biological replicates (n = 3). *P ≤ 0.05; **P < 0.01; ****P < 0.0001. In (B, D, E), statistical analysis was based on two‐way ANOVA.

Expression Data

Expression Detail
Antibody Labeling
Phenotype Data

Phenotype Detail
Acknowledgments
This image is the copyrighted work of the attributed author or publisher, and ZFIN has permission only to display this image to its users. Additional permissions should be obtained from the applicable author or publisher of the image. Full text @ EMBO J.