
- Title
-
Dusp1 regulates thermal tolerance limits in zebrafish by maintaining mitochondrial integrity
- Authors
- Wang, Y., Wang, H.M., Zhou, Y., Hu, L.H., Wan, J.M., Yang, J.H., Niu, H.B., Hong, X.P., Hu, P., Chen, L.B.
- Source
- Full text @ Zool Res
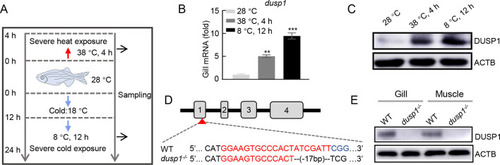
Temperature-induced expression of dusp1 and deletion of dusp1 in zebrafish A: Flowchart depicting cold and hot temperature treatments in zebrafish for sampling. Three-month-old zebrafish reared at 28 °C were subjected to cold treatment by exposure to 18 °C for 12 h and 8 °C for 12 h. Hot temperature treatment was carried out by exposing fish to 38 °C for 4 h, with controls maintained at 28 °C. Samples for qRT-PCR and immunoblot analysis were collected at three temperature-time points (28 °C, 38 °C 4 h, 8 °C 12 h). Sample size: n=30. B: Dusp1 expression under cold and hot treatment measured using qRT-PCR compared with normal temperature controls. Data are mean±SD. **: P<0.01; ***: P<0.001. C: Western blot analysis of DUSP1 protein levels in gills under thermal stress, with ACTB as the loading control. D: Schematic of targeted dusp1 gene editing by CRISPR/Cas9 and disruption of dusp1 at exon 1. E: Western blot validation of loss of dusp1 in dusp1-KO fish indicated by two tissues examined. |
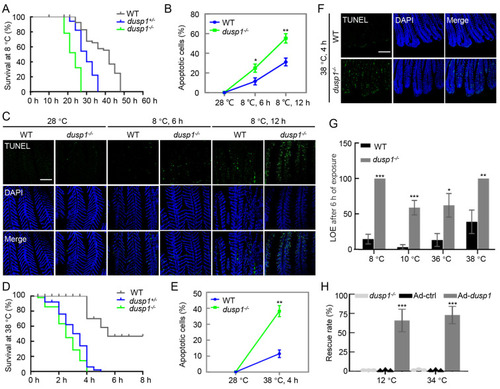
Negative impacts of dusp1 deletion on thermal stress tolerance in mutant fish Thermal challenges were the same as described above. Sample size was 30 for each thermal challenge and at least three biological replicates were performed. A: Kaplan-Meier curves of three genotypes (dusp1-/-, dusp1+/-, and WT) treated by 8 °C exposure. B: Quantified apoptotic signal in gills under cold exposure analyzed by ImageJ software. Student’s t-test, *: P<0.05; **: P<0.01. C: TUNEL assay showing apoptotic signal in gills under 8 °C treatment. Scale bar: 100 µm. D: Kaplan-Meier curves of three genotypes (dusp1-/-, dusp1+/-, and WT) under 38 °C exposure. E: Quantified apoptotic signal in gills under hot exposure analyzed by ImageJ software. Student’s t-test, **: P<0.01. F: TUNEL assay of apoptosis in gills under hot (38 °C for 4 h) treatment. Scale bar: 100 µm. G: Differences in upper and lower lethal temperature tolerance between WT and dusp1-/- zebrafish. LOE indicates loss of equilibrium. Half survival rates (i.e., LOE rate) of dusp1-/- fish occurred at 10 °C and 36 °C, respectively, under cold and heat challenges, while WT fish exhibited half survival rates at 8 °C and 38 °C, respectively. One-way ANOVA, *: P<0.05; **: P<0.01; ***: P<0.001. H: Rescue of dusp1-/- mutant by zebrafish dusp1 mRNA (Ad-dusp1). Adding dusp1 mRNA restored the survival rate of embryos under cold (8 °C) and hot (38 °C) treatment. The same amount of GFP mRNA (Ad-ctrl) and dusp1-/- embryos without injection were used as controls. One-way ANOVA, ***: P<0.001. |
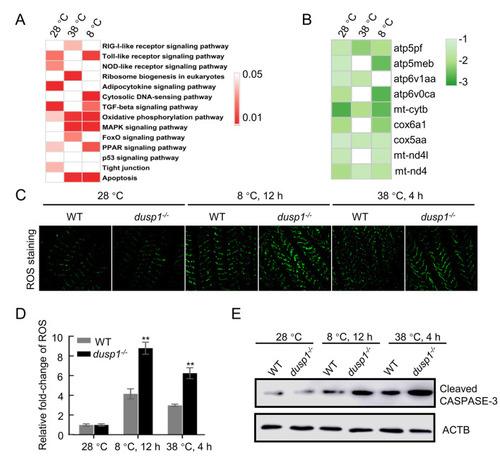
Disrupted MAPK and redox regulation and elevated susceptibility to thermal stress detected in gills of dusp1-deleted fish measured at three temperature-time points (28 °C, 38 °C 4 h, 8 °C 12 h) A: KEGG enrichment analysis of DEGs between dusp1-/- and WT treated at different temperatures. B: Markedly reduced expression of mitochondrial-related genes in KEGG “oxidative phosphorylation” pathway identified in dusp1-/- versus WT zebrafish at three temperatures. Log2 transformation of gene fold-change is indicated by the color-coded scale. C: DCFH-DA probe for ROS in the gills of dusp1-/- and WT zebrafish under different temperature treatments. Scale bar: 50 µm. D: Statistics of ROS fluorescence intensity detected in the gills of temperature-treated dusp1-/- and WT fish with ImageJ software. Statistically significant results between dusp1-/- and WT zebrafish are indicated by asterisks. Level of expression in WT (28 °C) was used as a normalizing factor and set to 1. Sample size: n=6 for each measurement, one-way ANOVA, **: P<0.01. E: Western blot assays of activated caspase-3, reflecting severity of mitochondrial-dependent apoptosis. ACTB was used as the loading control. |
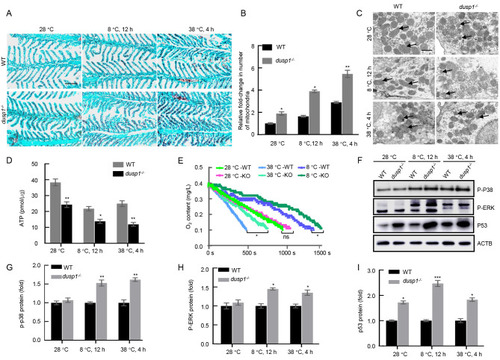
Dusp1 deficiency resulted in impaired mitochondrial structure and function A: Scarlet (red) and brilliant green (blue) staining of gill sections of dusp1-/- and WT zebrafish under different temperature treatments. Mitochondria are in dark red and gill filaments are in green. Scale bar: 50 µm. Sample size=6 for each temperature-time treatment. B: Relative intensity of red fluorescence of the gill reflecting average number of mitochondria present in the gill section. Student’s t test, *: P<0.05; **: P<0.01. Sample size: n=6. C: Transmission electron microscopy of mitochondrial structure in the gills of dusp1-/- and WT zebrafish under different temperature treatments. Dark circular structures are typical mitochondria. Mitochondria with abnormal shapes are indicated by arrows. Scale bar: 1 µm. D: ATP production measured by ATP Assay Kit (Beyotime, China) in dusp1-/- and WT zebrafish gills under different temperature treatments. Student’s t test, *: P<0.05; **: P<0.01. Sample size: n=6 for each temperature-time point. E: Oxygen consumption rate measured using a respiratory oxygen consumption meter in dusp1-/- and WT fish under different temperature treatments. Sample size: n=6 for each curve, one-way ANOVA, *: P<0.05, ns: No significant difference. F–I: Western blot analyses of p-P38, p-ERK, and p53 in dusp1-/- and WT zebrafish exposed to different temperatures. Sample size n=6 for each measurement. |

DUSP1 deletion caused redox dysregulation in human HEK293T cells A: Flow cytometry measurement of ROS content at three temperature-time points (37 °C, 43 °C 5 h, 13 °C 15 h) using a ROS Assay Kit (Beyotime, China) in DUSP1-/- and control HEK293T cells. B: Statistics of ROS fluorescence intensity in samples measured in (A) analyzed using FlowJo software. One-way ANOVA, *: P<0.05; ***: P<0.001. C, D: PI staining to detect dead cells in DUSP1-/- and control HEK293T cells exposed to high and low temperatures. Scale bar: 100 µm. Student’s t-test, *: P<0.05; ***: P<0.001. E: OD450 values of DUSP1-/- and control cells measured by CCK8 assay. One-way ANOVA, *: P<0.05; **: P<0.01. F: Western blot analysis of activated caspase-3 to detect mitochondrial dependent apoptosis in DUSP1-/- and control cells. ACTB was used as the loading control. G: MitoTracker staining of DUSP1-/- and control cells to reveal mitochondrial morphology at different temperatures. Scale bar: 20 µm. H: Transmission electron microscopy of mitochondrial structure in DUSP1-/- and WT HEK293T cells exposed to three temperatures. Arrows in panels of DUSP1-/- cells indicate fragmented mitochondria. Scale bar: 2 µm. I, J: JC-1 probe to measure mitochondrial membrane potential in DUSP1-/- and WT cells examined under fluorescence microscopy. CCCP was used as a positive control to induce a decrease in mitochondrial membrane potential. Scale bar: 20 µm. One-way ANOVA, **: P<0.01; ***: P<0.001. K: Relative levels of ATP production in DUSP1-/- and control cells exposed to three temperatures. One-way ANOVA, *: P<0.05. |

Western blot detection of major factors in DUSP1-MAPK-DRP1 axis in DUSP1-/- 293 T cells A–C: Western blotting of p-P38 and P53 in DUSP1-/- and WT 293T cells at three temperature time points. D–F: Western blot analyses of p-P38 and p53 in presence of Y27632. G, H: Western blot analysis of apoptosis-related protein BAX. I, J: Western blotting showing increased phosphorylation of DRP1 at S616 in DUSP1-/- cells. ACTB was used as the loading control. |
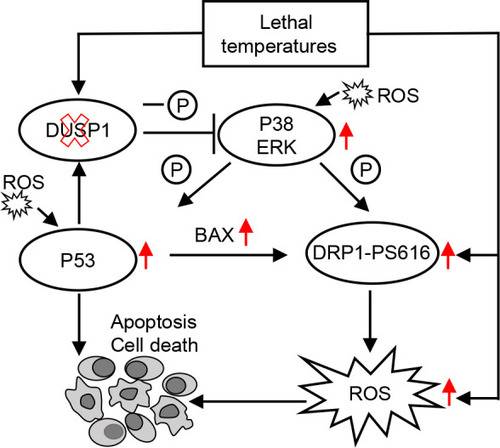
Proposed DUSP1-MAPK-DRP1 signaling cascade regulating thermal tolerance limit in zebrafish Red arrows indicate elevation in proteins when dusp1 is deleted (indicated by red cross). |