
Fig. 4
- ID
- ZDB-FIG-230501-10
- Publication
- Wang et al., 2023 - Dusp1 regulates thermal tolerance limits in zebrafish by maintaining mitochondrial integrity
- Other Figures
- All Figure Page
- Back to All Figure Page
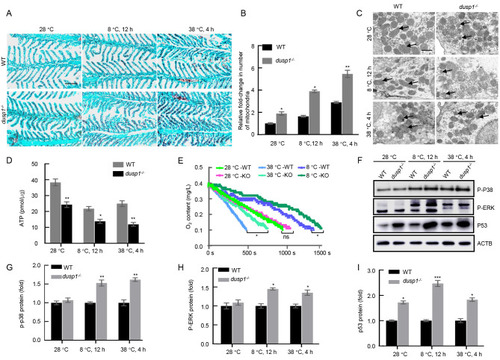
Dusp1 deficiency resulted in impaired mitochondrial structure and function A: Scarlet (red) and brilliant green (blue) staining of gill sections of dusp1-/- and WT zebrafish under different temperature treatments. Mitochondria are in dark red and gill filaments are in green. Scale bar: 50 µm. Sample size=6 for each temperature-time treatment. B: Relative intensity of red fluorescence of the gill reflecting average number of mitochondria present in the gill section. Student’s t test, *: P<0.05; **: P<0.01. Sample size: n=6. C: Transmission electron microscopy of mitochondrial structure in the gills of dusp1-/- and WT zebrafish under different temperature treatments. Dark circular structures are typical mitochondria. Mitochondria with abnormal shapes are indicated by arrows. Scale bar: 1 µm. D: ATP production measured by ATP Assay Kit (Beyotime, China) in dusp1-/- and WT zebrafish gills under different temperature treatments. Student’s t test, *: P<0.05; **: P<0.01. Sample size: n=6 for each temperature-time point. E: Oxygen consumption rate measured using a respiratory oxygen consumption meter in dusp1-/- and WT fish under different temperature treatments. Sample size: n=6 for each curve, one-way ANOVA, *: P<0.05, ns: No significant difference. F–I: Western blot analyses of p-P38, p-ERK, and p53 in dusp1-/- and WT zebrafish exposed to different temperatures. Sample size n=6 for each measurement. |