
|
Fig. 5
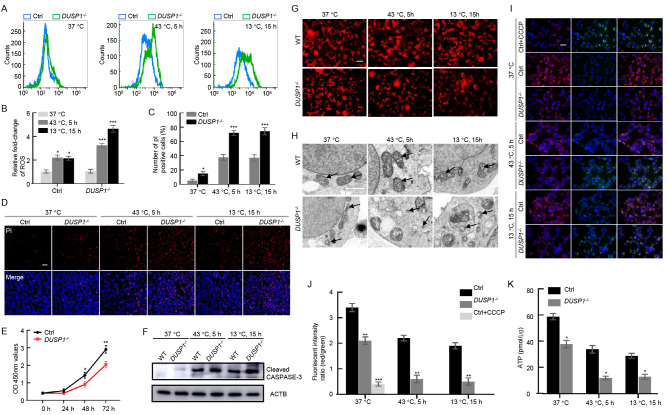
DUSP1 deletion caused redox dysregulation in human HEK293T cells
A: Flow cytometry measurement of ROS content at three temperature-time points (37 °C, 43 °C 5 h, 13 °C 15 h) using a ROS Assay Kit (Beyotime, China) in DUSP1-/- and control HEK293T cells. B: Statistics of ROS fluorescence intensity in samples measured in (A) analyzed using FlowJo software. One-way ANOVA, *: P<0.05; ***: P<0.001. C, D: PI staining to detect dead cells in DUSP1-/- and control HEK293T cells exposed to high and low temperatures. Scale bar: 100 µm. Student’s t-test, *: P<0.05; ***: P<0.001. E: OD450 values of DUSP1-/- and control cells measured by CCK8 assay. One-way ANOVA, *: P<0.05; **: P<0.01. F: Western blot analysis of activated caspase-3 to detect mitochondrial dependent apoptosis in DUSP1-/- and control cells. ACTB was used as the loading control. G: MitoTracker staining of DUSP1-/- and control cells to reveal mitochondrial morphology at different temperatures. Scale bar: 20 µm. H: Transmission electron microscopy of mitochondrial structure in DUSP1-/- and WT HEK293T cells exposed to three temperatures. Arrows in panels of DUSP1-/- cells indicate fragmented mitochondria. Scale bar: 2 µm. I, J: JC-1 probe to measure mitochondrial membrane potential in DUSP1-/- and WT cells examined under fluorescence microscopy. CCCP was used as a positive control to induce a decrease in mitochondrial membrane potential. Scale bar: 20 µm. One-way ANOVA, **: P<0.01; ***: P<0.001. K: Relative levels of ATP production in DUSP1-/- and control cells exposed to three temperatures. One-way ANOVA, *: P<0.05.