
- Title
-
Physical confinement promotes mesenchymal trans-differentiation of invading transformed cells in vivo
- Authors
- Zulueta-Coarasa, T., Fadul, J., Ahmed, M., Rosenblatt, J.
- Source
- Full text @ iScience

KRasV12 cell nuclei deform after they invade (A and B) Orthogonal and projection views of an invading cell expressing EGFP-KRasV12 (A, B) and H2B-RFP and mCherry-Utrophin (B′) in XZ (A) or XY (B), with time before and after BCE indicated. Scale bar, 50 μm C, nuclear circularity over time for the cell shown in A, B. D, E, example cells expressing EGFP-KRasV12 (D and E) and H2B-RFP and mCherry-Utrophin (D′, E′) in the outer epithelium (D) or invaded inside the embryo (E), quantified in F & G. Scale bars, 50 μm F, nuclear circularity in surface (n = 25) and invaded (n = 24) KRasV12 cells. (G) Nuclear circularity of surface and invaded KRasV12 cells located in the yolk ( (H and I) EGFP-KRasV12 cells in an embryo stained for GFP, phospho-histone H2A.X, and DAPI located on the surface (H) or inside the embryo (I). Scale bars, 20 μm. (J) Percentage of KRasV12-invaded cells expressing phospho-histone H2A.X in the embryonic surface (n = 6) and inside the embryo (n = 6). In A, B, D, E, H, I, dotted lines outline the cell nucleus. In F, G, J, the error bars are SD(SD), the box the SEM(SEM), and the gray lines, the mean. ∗p < 0.05, ∗∗p < 0.01, ∗∗∗p < 0.001. See also |

Loss of (A and B) Sample images of neural tube cells expressing HRas-EGFP in control (A) and (D–G) Images of EGFP-KRasV12-expressing invaded cells in controls (D, E) and (H) Number of invaded cells per embryo in control (n = 11) and (I) Percentage of KRasV12-invaded cells expressing N-cadherin in controls (n = 11) and (J and K) Examples of neuron-like morphology cells expressing EGFP-KRasV12 in control (J) and (L) Percentage of KRasV12-invaded cells with neuron-like morphologies in control (n = 11) and |
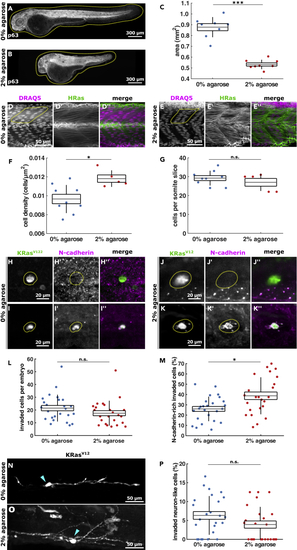
Embryo confinement in agarose promotes KRasV12 cell (A and B) Example 2 dpf embryos stained for p63 that were grown from 1 to 2 dpf in 0% (A) or 2% agarose (B), with dotted lines outlining embryos. Scale bars, 300 μm. (C) Area of 2 dpf embryos embedded in 0% (n = 8) or 2% agarose (n = 8) from 1 to 2 dpf. (D and E) Somite cells expressing HRas-EGFP in embryos grown in 0% (D) and 2% (E) agarose, with dotted lines demarking half somites. Scale bars, 50 μm. (F) Somite cell density in control (0% agarose) embryos (n = 9) and embryos grown in 2% agarose (n = 5). (G) Number of cells per somite (in xy slice) in embryos grown in 0% agarose (n = 9) or 2% agarose (n = 5). (H–K) Examples of invaded EGFP-KRasV12-expressing cells (highlighted in dotted line) in embryos embedded in 0% (H, I) and 2% (J, K) agarose stained with GFP and N-cadherin. Scale bars, 20 μm. (L) Number of invaded cells per embryo in controls (n = 25) and 2% agarose embryos (n = 24). (M) Percentage of KRasV12-invaded cells expressing N-cadherin from embryos grown in 0% (n = 25) and 2% (n = 24) agarose. (N and O) Examples of EGFP-KRasV12 cells with a neuron-like shape in embryos grown in 0% (N) and 2% (O) agarose, where arrowheads denote cell body. Scale bars, 50 μm. (P) Percentage of KRasV12-invaded cells adopting a neuron-like morphology in 0% (n = 25) and 2% (n = 24) agarose. In C, F, G, L, M, P, the error bars are SD, the box, SEM, and the lines denote mean. n.s., not significant, ∗p < 0.05, ∗∗∗p < 0.001. |
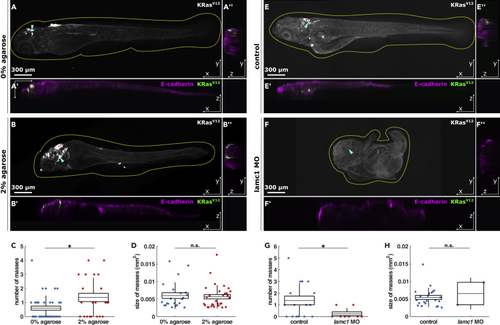
Experimental confinement promotes internal cell masses (A and B) Representative orthogonal views of 4.5 dpf embryos quantified in C & D expressing EGFP-KRasV12, stained for e-cadherin, and grown from 1 to 2 dpf in 0% (A) or 2% agarose (B), in XY (A, B), XZ (A′, B′) and YZ (A″, B″), with dotted lines outlining embryos and arrowheads the coordinates of XZ orthogonal sections. Scale bars, 300 μm. (C) Number of cell masses per embryo in 0% (n = 37) or 2% agarose (n = 22) embryos. (D) Cell mass areas from embryos grown in 0% (n = 22) or 2% agarose (n = 30). 4.5 dpf control (E) and (G) Number of cell masses per embryo in controls (n = 16) or (H) Area of cell masses in control (n = 22) or |