
|
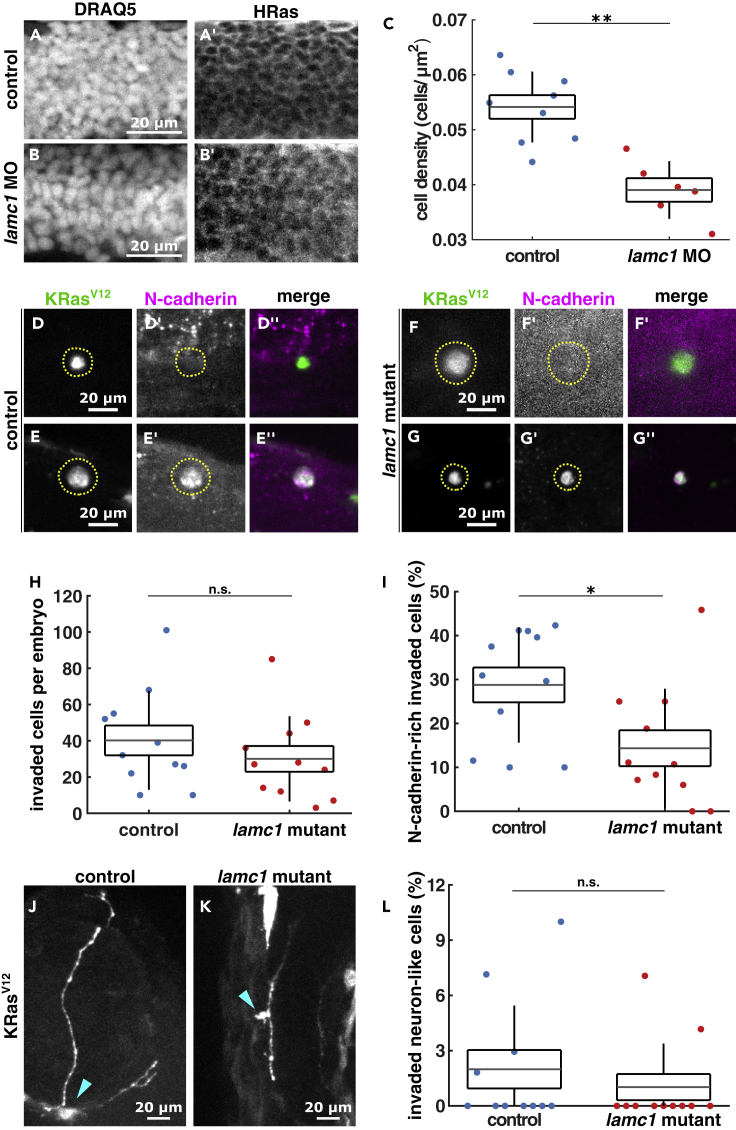
Figure 2
Loss of
(A and B) Sample images of neural tube cells expressing HRas-EGFP in control (A) and
(D–G) Images of EGFP-KRasV12-expressing invaded cells in controls (D, E) and
(H) Number of invaded cells per embryo in control (n = 11) and
(I) Percentage of KRasV12-invaded cells expressing N-cadherin in controls (n = 11) and
(J and K) Examples of neuron-like morphology cells expressing EGFP-KRasV12 in control (J) and
(L) Percentage of KRasV12-invaded cells with neuron-like morphologies in control (n = 11) and