
|
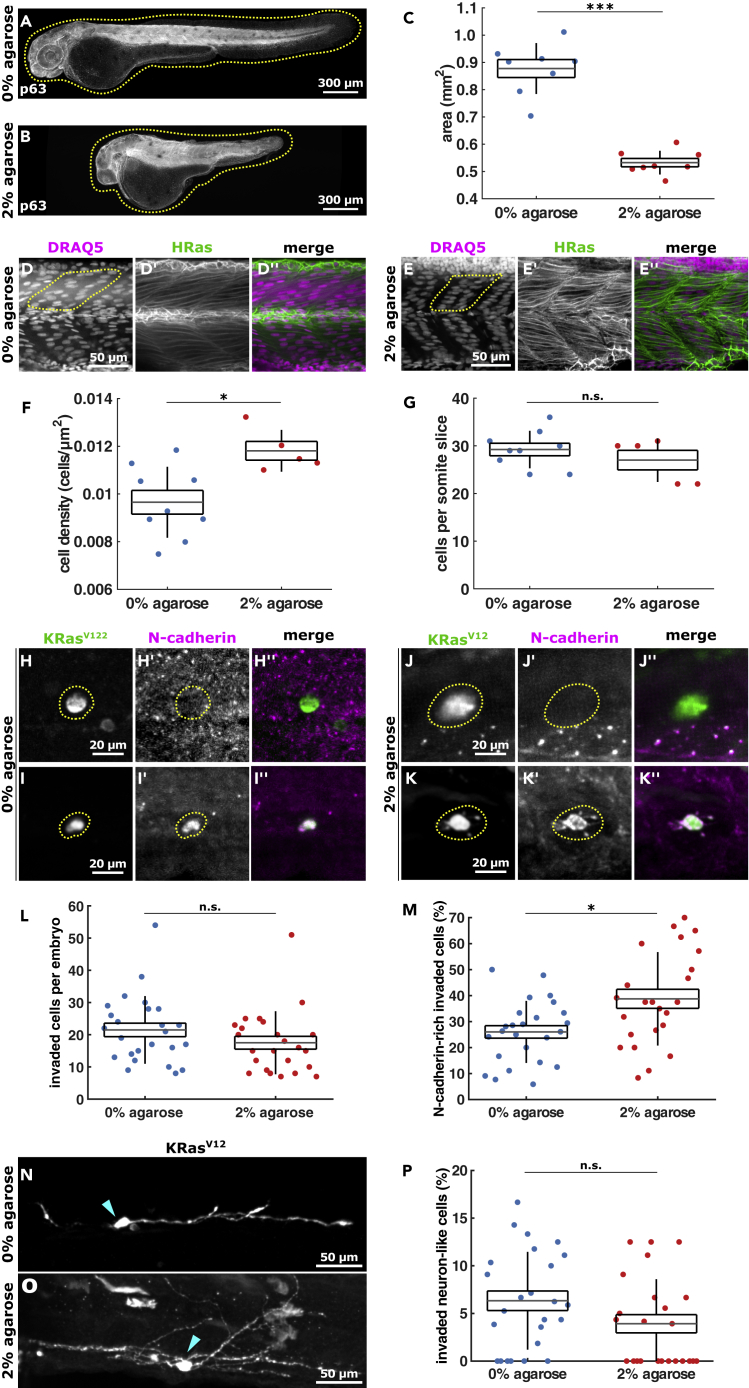
Figure 3
Embryo confinement in agarose promotes KRasV12 cell
(A and B) Example 2 dpf embryos stained for p63 that were grown from 1 to 2 dpf in 0% (A) or 2% agarose (B), with dotted lines outlining embryos. Scale bars, 300 μm.
(C) Area of 2 dpf embryos embedded in 0% (n = 8) or 2% agarose (n = 8) from 1 to 2 dpf.
(D and E) Somite cells expressing HRas-EGFP in embryos grown in 0% (D) and 2% (E) agarose, with dotted lines demarking half somites. Scale bars, 50 μm.
(F) Somite cell density in control (0% agarose) embryos (n = 9) and embryos grown in 2% agarose (n = 5).
(G) Number of cells per somite (in xy slice) in embryos grown in 0% agarose (n = 9) or 2% agarose (n = 5).
(H–K) Examples of invaded EGFP-KRasV12-expressing cells (highlighted in dotted line) in embryos embedded in 0% (H, I) and 2% (J, K) agarose stained with GFP and N-cadherin. Scale bars, 20 μm.
(L) Number of invaded cells per embryo in controls (n = 25) and 2% agarose embryos (n = 24).
(M) Percentage of KRasV12-invaded cells expressing N-cadherin from embryos grown in 0% (n = 25) and 2% (n = 24) agarose.
(N and O) Examples of EGFP-KRasV12 cells with a neuron-like shape in embryos grown in 0% (N) and 2% (O) agarose, where arrowheads denote cell body. Scale bars, 50 μm.
(P) Percentage of KRasV12-invaded cells adopting a neuron-like morphology in 0% (n = 25) and 2% (n = 24) agarose. In C, F, G, L, M, P, the error bars are SD, the box, SEM, and the lines denote mean. n.s., not significant, ∗p < 0.05, ∗∗∗p < 0.001.