
|
Figure 1
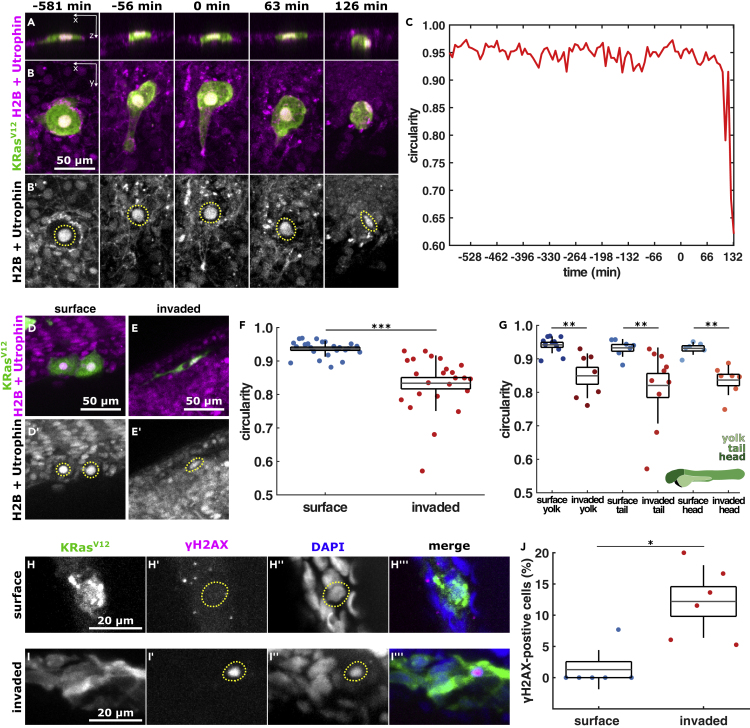
KRasV12 cell nuclei deform after they invade
(A and B) Orthogonal and projection views of an invading cell expressing EGFP-KRasV12 (A, B) and H2B-RFP and mCherry-Utrophin (B′) in XZ (A) or XY (B), with time before and after BCE indicated. Scale bar, 50 μm C, nuclear circularity over time for the cell shown in A, B. D, E, example cells expressing EGFP-KRasV12 (D and E) and H2B-RFP and mCherry-Utrophin (D′, E′) in the outer epithelium (D) or invaded inside the embryo (E), quantified in F & G. Scale bars, 50 μm F, nuclear circularity in surface (n = 25) and invaded (n = 24) KRasV12 cells.
(G) Nuclear circularity of surface and invaded KRasV12 cells located in the yolk (
(H and I) EGFP-KRasV12 cells in an embryo stained for GFP, phospho-histone H2A.X, and DAPI located on the surface (H) or inside the embryo (I). Scale bars, 20 μm.
(J) Percentage of KRasV12-invaded cells expressing phospho-histone H2A.X in the embryonic surface (n = 6) and inside the embryo (n = 6). In A, B, D, E, H, I, dotted lines outline the cell nucleus. In F, G, J, the error bars are SD(SD), the box the SEM(SEM), and the gray lines, the mean. ∗p < 0.05, ∗∗p < 0.01, ∗∗∗p < 0.001. See also