FIGURE SUMMARY
Title

Novel Cinnamaldehyde Derivatives Inhibit Peripheral Nerve Degeneration by Targeting Schwann Cells

Authors
Chun, Y.L., Park, K.H., Pallavi, B., Eom, W.J., Park, C., Huh, Y., Lee, Y., Lee, J., Kim, S.H., Yeo, S.G., Chung, H.J., Kim, B.S., Jeong, N.Y., Jung, J.
Source
Full text @ Antioxidants (Basel)

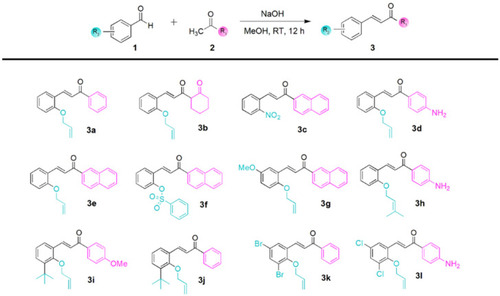
Synthesis of CAH derivatives (α,β-unsaturated ketones) from Claisen–Schmidt condensation of oxygenated acetophenones. Substrate scope and structures of CAH derivatives (3a3l) are shown in the lower panel.

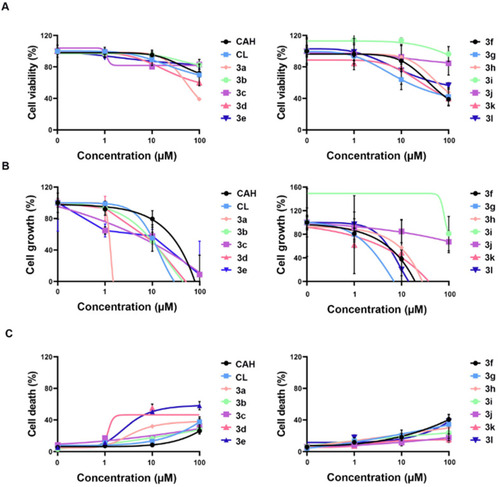
In vitro efficacy of CAH derivatives 3a3l using therapeutic indices in SW10 cells treated with 1–100 µM of each compound for 10 h. (A) Dose–effect curve plot of 3a3l indicated the cell viability of SW10 cells. (B) Cell growth curves of 3a3l representing inhibition of cell proliferation were determined by the MTS assay in a dose-dependent manner. (C) Cell death was calculated as a ratio of live cells over dead cells via trypan blue exclusion assay. All CAH derivatives showed no in vitro efficacy in concentrations of ≤100 nM and 100% cell death in the concentration of 1 mM, respectively. CAH, cinnamaldehyde. CL, chalcone.

Docking-simulation results between TRPA1 and CAH derivatives. (A) The binding affinity energies (kcal/mol) of 3a3l with TRPA1 were estimated by AutoDock Vina software. (B) Three-dimensional structure of TRPA1 (PDB code: 6X2J) was used from the Protein Data Bank database (https://www.rcsb.org/; accessed on 10 March 2022). (C) Docking conformations of 3c, 3e, 3f, and 3g showing high affinity with TRPA1 were visualized, and the zoom-in view of each docked ligand inside the TRPA1 was displayed. The structure of ligands was represented as yellow, the residues in the ligands were indicated as pink, and predicted hot spots were shown as blue. CAH, cinnamaldehyde.

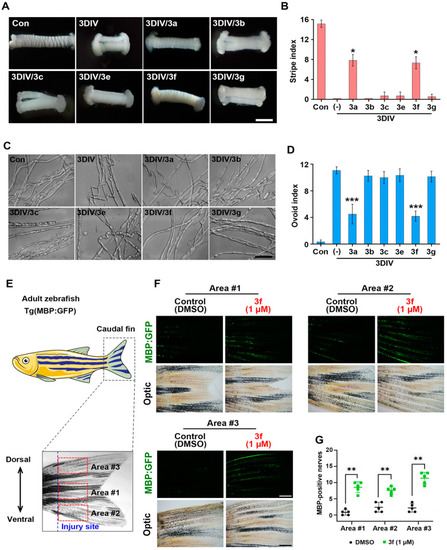
Ex vivo and in vivo efficacy of CAH derivatives against PND. (A) Sciatic nerve explant culture was used for evaluating ex vivo efficacy. Transverse stripes of sciatic nerve explants in the presence or absence of compounds of 100 µM were observed and photographed under a stereomicroscope for three days in vitro (3DIV). Scale bar, 50 µm. The compounds were 3a, 3b, 3c, 3e, 3f, and 3g. (B) The number of transverse stripes in a 2 mm-long sciatic nerve was defined as stripe index and measured by counting under a stereomicroscope (n = 3 mice). (C) Ovoid-shaped myelin formation appeared in the sciatic nerve fibers cultured for 3DIV with or without treatment of the compounds. (D) The ovoid index was obtained by counting the ovoid-shaped myelin in 200 µm-long sciatic nerve fibers under a differential interference contrast (DIC) filtered microscope. Scale bar, 50 µm. (E) In vivo PND model using [Tg(mbp:eGFP)] zebrafish are visualized. (F) MBP: eGFP fluorescence in the caudal fin (green) with 3f treatment of 1 µM for 10 days was observed under a stereomicroscope. Scale bar, 0.25 mm. (G) The number of intact GFP fluorescence was counted in three areas (1 × 1 mm2) of the distal part of the injury. * p < 0.05, ** p < 0.01, and *** p < 0.001.

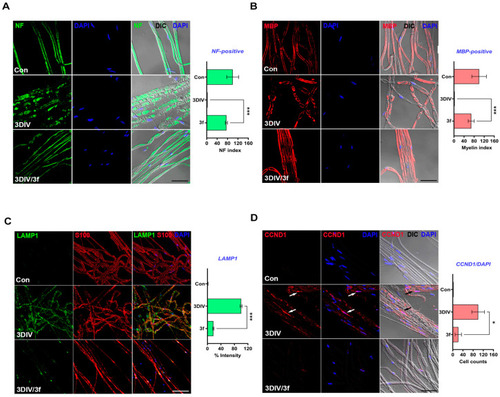
Inhibitory effect of 3f on the phenotypes of PND. (A) Immunostaining was performed in explant sciatic nerve fibers. Neurofilament (NF, green) and 4′,6-Diamidine-2′-phenylindole (DAPI, blue) were used as markers for axons and nucleus, respectively. NF index was calculated by counting the 100 µm-long consecutive lines (n = 3 mice). Scale bar, 50 µm. 3DIV, 3 days in vitro. Con, control. (B) Myelin sheath was identified using an anti-myelin basic protein (MBP, red) antibody counterstained with DAPI. Scale bar, 50 µm. MBP index was estimated by calculating the 100 µm-long consecutive lines of MBP-marked nerve fibers (n = 3 mice). (C) Immunostaining with lysosomal-associated membrane protein 1 (LAMP1, green) combined with DAPI (blue) in ex vivo sciatic nerve fibers showed the inhibitory of the 3f on Schwann cell dedifferentiation. Scale bar, 50 µm. The intensity of LAMP1 expression was quantitatively measured in the teased sciatic nerve fibers within 200 × 200 μm2 widths of teasing slides (n = 3 mice). The intensity at 3DIV was set as 100%. (D) Cyclin D1 (CCND1, red) and DAPI (blue) were immunostained in ex vivo sciatic nerve fibers. The arrows indicated CCND1/DAPI double-positive cells. Scale bar, 50 µm. Quantification was proceeded by calculating CCND1-marked cells out of 200 DAPI-positive cells and then compared to that of the nerve fibers at 3DIV (n = 3 mice). * p < 0.05, *** p < 0.001.

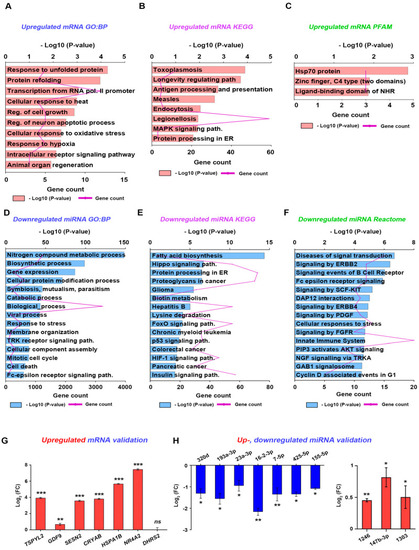
In silico analysis for the pharmacological mechanism of 3f and the validation in hTERT02.3 cells. Bioinformatics analysis using 150 DEGs or 21 DE miRNAs regulated by CAH in non-small cell lung cancer cell lines (NSCLC: SK-MES-1 and NCI-H226 cell lines) [11] was performed. (A,D) Gene ontology (GO), (B,E) Kyoto encyclopedia of genes and genomes (KEGG), and (C,F) protein domain analyses were performed using DAVID bioinformatics resources (https://david.ncifcrf.gov/; accessed on 10 March 2022) and PFAM protein family database (https://pfam.xfam.org/; accessed on 10 March 2022). The bar graph represented the value of ‘−log (p-value)’, and the line graph showed the gene counts. (G) The mRNA levels of seven coding genes related to cell growth and oxidative stress were validated in hTERT02.3 cells with or without 3f treatment by qPCR. ** p < 0.01 and *** p < 0.001. (H) The miRNA levels of 10 miRNAs related to cell cycle were validated in hTERT02.3 cells by qPCR. * p < 0.05 and ** p < 0.01.

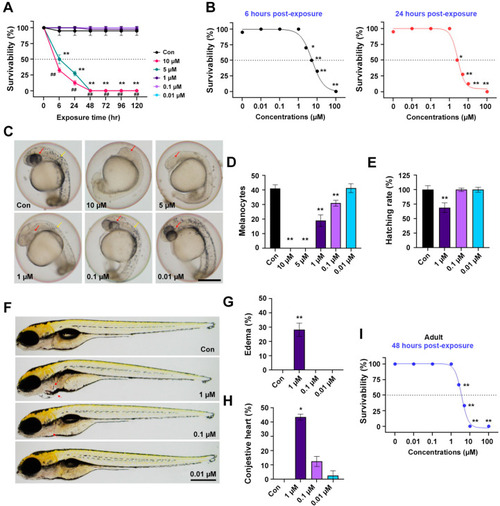
In vivo toxicity assay of 3f in the embryo and adult zebrafish. (A) Time-dependent survival rates throughout 0–120 h post exposure (hpe) in zebrafish embryos (n = 25 embryos/group). * p < 0.05, ** p < 0.01 compared to control and ## p < 0.01 compared to 5 hpe groups. (B) Concentration-dependent survival curves of 3f after continuous exposure for 6 h (left panel, black) and 24 h (right panel, red) in zebrafish embryos (n = 25 embryos/group). * p < 0.05 and ** p < 0.01. (C) Representative images of melanocyte development in zebrafish embryos exposed to 3f at 24 hpe. Scale bar, 0.25 mm. (D) The number of melanocytes in the head and trunk of zebrafish embryos was counted in three experiments. ** p < 0.01. (E) Hatching rate of zebrafish embryos after 48 h exposure to 3f (n = 25 embryos/group) was calculated. ** p < 0.01. (F) Malformation of zebrafish larvae exposed to 3f at 120 hpe was estimated. 3f-exposed zebrafish (1 µM) showed pericardial edema and congestive heart (red arrow). Scale bar, 0.5 mm. Quantification of pericardial edema (G) and congestive heart (H) in zebrafish larvae exposed to 3f for 120 h (n = 25 embryos/group) were shown. * p < 0.05 and ** p < 0.01. (I) Concentration-dependent survival curves of 3f after 3 consecutive days of exposure in adult zebrafish (n = 25 embryos/group) were displayed. Error bars indicated the standard deviation of the mean. ** p < 0.01.

Acknowledgments
This image is the copyrighted work of the attributed author or publisher, and ZFIN has permission only to display this image to its users. Additional permissions should be obtained from the applicable author or publisher of the image. Full text @ Antioxidants (Basel)