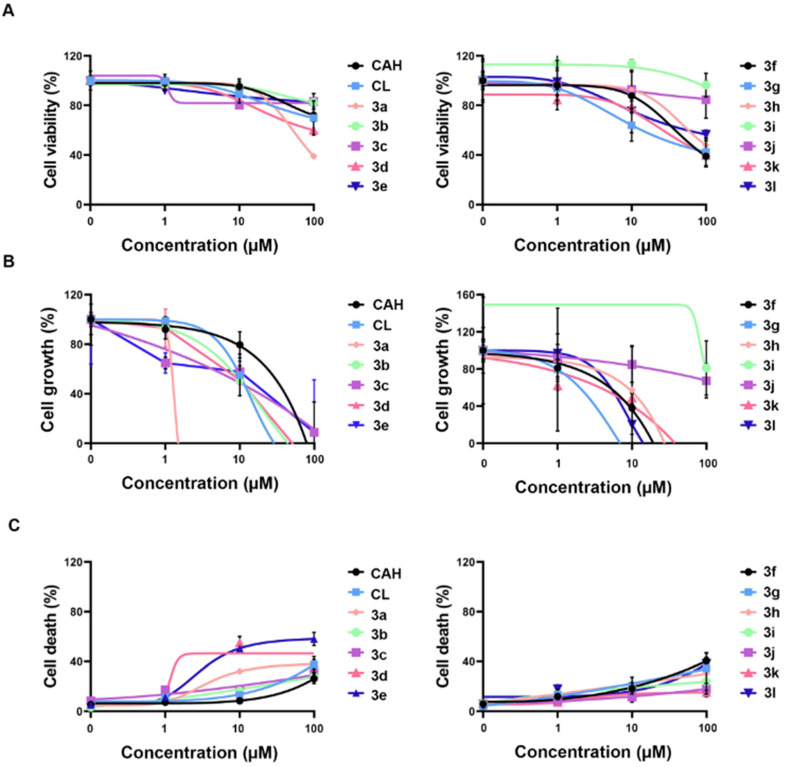
IMAGE

Figure 2

ID
ZDB-IMAGE-221031-191
Source
Figures for Chun et al., 2022
Image
Figure Caption

Figure 2

In vitro efficacy of CAH derivatives 3a3l using therapeutic indices in SW10 cells treated with 1–100 µM of each compound for 10 h. (A) Dose–effect curve plot of 3a3l indicated the cell viability of SW10 cells. (B) Cell growth curves of 3a3l representing inhibition of cell proliferation were determined by the MTS assay in a dose-dependent manner. (C) Cell death was calculated as a ratio of live cells over dead cells via trypan blue exclusion assay. All CAH derivatives showed no in vitro efficacy in concentrations of ≤100 nM and 100% cell death in the concentration of 1 mM, respectively. CAH, cinnamaldehyde. CL, chalcone.

Acknowledgments
This image is the copyrighted work of the attributed author or publisher, and ZFIN has permission only to display this image to its users. Additional permissions should be obtained from the applicable author or publisher of the image. Full text @ Antioxidants (Basel)