
- Title
-
Prolonged Dexamethasone Exposure Enhances Zebrafish Lateral-Line Regeneration But Disrupts Mitochondrial Homeostasis and Hair Cell Function
- Authors
- Saettele, A.L., Wong, H.C., Kindt, K.S., Warchol, M.E., Sheets, L.
- Source
- Full text @ J. Assoc. Res. Otolaryngol.
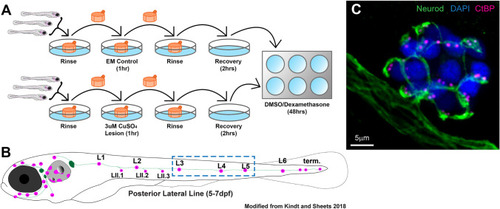
Workflow of CuSO4 lateral-line lesion and dexamethasone exposure. A Diagram of workflow for CuSO4 lesions and dexamethasone exposure. Larvae (5 dpf) were placed into cell strainers and moved between rinse and lesion steps, while being allowed to swim freely during recovery and dexamethasone exposure. B Diagram of a 5–7 dpf zebrafish larvae showing the distribution of lateral-line neuromasts (magenta) and innervating afferent nerves (green). This study focused on neuromasts L3, L4, and L5 (blue dashed-line box). C Representative maximum intensity projection of confocal z-stack image of neuromast L4 in a 7 dpf zebrafish larvae. Labels: afferent neurons labeled with GFP (green; tgBAC (neurod1: GFP), DAPI-labeled hair cell nuclei (blue), and immunolabeled presynaptic ribbons (magenta; pan-CtBP) |
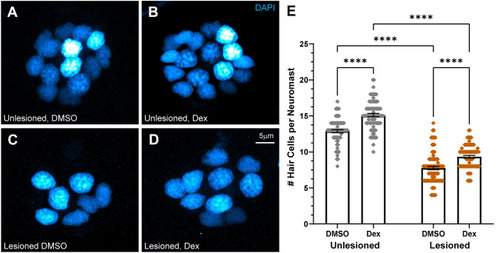
Dexamethasone increased hair cell number in intact and regenerating neuromasts. A–D Representative maximum intensity projection images of 7 dpf neuromasts, with DAPI-labeled hair cell nuclei (blue). Larval lateral-line neuromasts were either left intact (unlesioned) (A, B) or lesioned by treatment with 3 µM CuSO4 for 1 h (C, D). Larvae were then allowed to recover for 2 h, then exposed for 48 h to either 0.1 % DMSO (carrier) (A, C) or dexamethasone (B, D). E Scatter plot graph of hair cell number per neuromast. Bars indicate mean and SEM. Each dot represents a single neuromast on an individual fish. Both intact (unlesioned) and regenerating neuromasts showed a significant increase in the number of hair cells per neuromast in dexamethasone-treated fish relative to DMSO controls (****adjusted P < 0.0001;). N = 5–10 fish per condition per trial; 7 experimental trials |
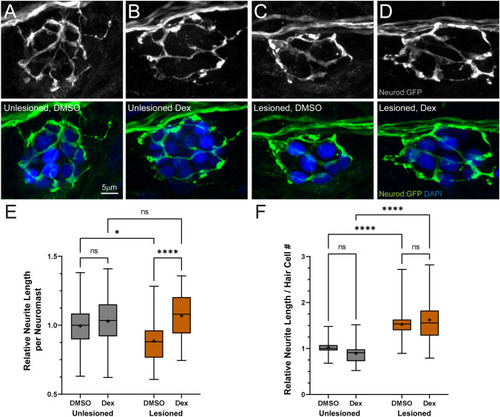
Dexamethasone-enhanced afferent innervation of regenerating neuromasts. A–D Representative maximum intensity projection images of pLL neuromasts in 7 dpf tgBAC (neurod1: GFP) larvae showing afferent neurons (green) and DAPI-labeled hair cell nuclei (blue). Neuromasts were either unlesioned (A, B) or lesioned with CuSO4 (C, D), then allowed to regenerate for 48 h while exposed to DMSO (carrier) (A, C) or dexamethasone (B, D). E, F Box plots of neurite length per neuromast (E) and neurite length per hair cell (F), with whiskers at min/max and mean values marked with “ + ”. Data for each experimental trial were normalized to the median value of unlesioned controls. Regenerating neuromasts (orange plots) in dexamethasone-treated fish had significantly longer neurites per neuromast (E) (****adjusted P < 0.0001); however, the difference in length in dexamethasone-treated fish was not significant relative to the total number of hair cells/neuromast, when compared to DMSO controls (F). N = 4–7 fish per condition per trial; 6 experimental trials |

Dexamethasone exposure did not alter the number of afferent synapses in neuromast hair cells. A–D Representative maximum intensity projection images of 7 dpf pLL neuromasts, with hair cell presynaptic ribbons labeled via CtBP antibody (magenta), post-synaptic densities labeled via MAGUK antibody (green), and hair cell nuclei labeled with DAPI (blue). Neuromasts were either unlesioned (A, B) or lesioned with CuSO4 (C, D), then allowed to regenerate for 48 h while exposed to DMSO (carrier) (A, C) or dexamethasone (B, D). E Scatter plots with mean and SEM bars showing no significant difference in the number of intact synapses in dexamethasone-treated fish, compared to DMSO controls for both lesioned and intact neuromasts. Each dot represents a single neuromast on an individual fish. Notably, a significantly greater number of intact synapses per hair cell were observed in regenerating neuromasts relative to neuromasts that were not lesioned (adjusted ***P < 0.001 (DMSO), *P < 0.05 (Dex)). N = 5–10 fish per condition per trial; 4 experimental trials |
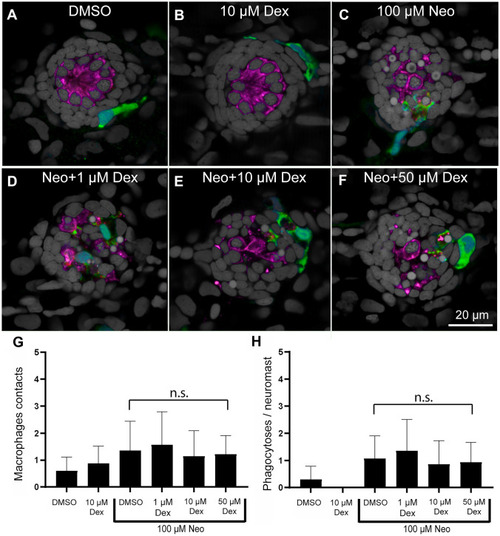
Treatment with dexamethasone did not inhibit macrophage response to neuromast injury. A–F Representative confocal images of control (A, B) and neomycin injured neuromasts (C–F). Larvae (6 dpf) were treated for 24 h with 1, 10, or 50 µM dexamethasone, then exposed for 30 min to 100 µM neomycin to induce rapid neuromast injury. After drug exposures, all specimens were fixed and processed for labeling of macrophages (green, YFP), hair cells (magenta, Otoferlin) and nuclei (gray, DAPI). Normal localization of macrophages was observed in control fish (A, B) and no inhibition was observed in neuromasts treated with neomycin (C–F). G, H Dexamethasone pretreatment did not affect macrophage contacts with dying hair cells (G, P > 0.9999, Dunn’s multiple comparisons test) or the number of phagocytotic events (H, P > 0.9999, Dunn’s multiple comparisons test). Bars indicate SD. N = 15 fish/group; 2 experimental trials |
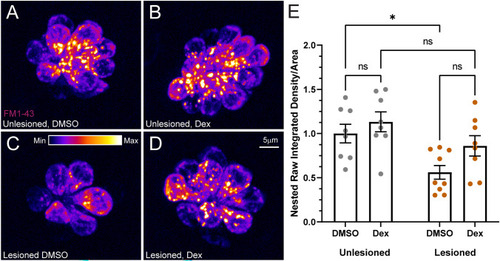
FM1-43 uptake was not significantly affected by dexamethasone exposure. A–D Representative maximum intensity projection images of pLL neuromasts in live 7 dpf immediately after brief (20 s) FM1-43 exposure. Prior to FM1-43 exposure, neuromasts were either left intact (A, B) or lesioned with CuSO4 (C, D), then allowed to regenerate for 48 h while exposed to DMSO (carrier) (A, C) or dexamethasone (B, D). The LUT bar (C) shows the range of intensity values, starting at 0 (min) to 400 (max). E Average FM1-43 intensity per neuromast is not affected by dexamethasone exposure. Scatter plots show raw integrated density (i.e., sum of the pixel values)/area values with SEM bars. Each dot represents the average values of neuromasts L3–L5 for one fish. Values were normalized for each experiment using the inverse median of the unlesioned control values. The data show no significant differences in intensity for dexamethasone-treated fish, relative to DMSO controls (adjusted *P < 0.05). N = 2–3 fish per condition per trial; 4 experimental trials |
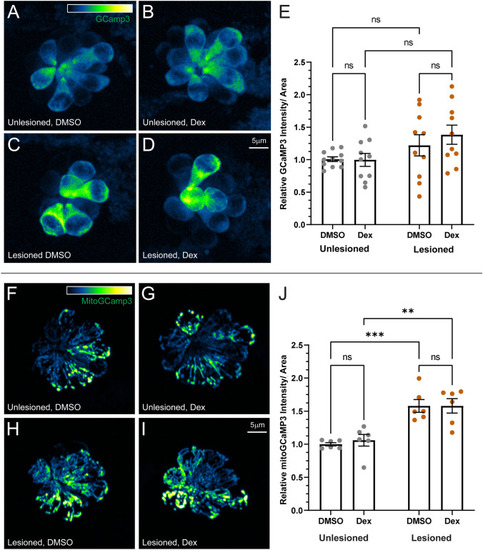
Dexamethasone did not affect hair cell cytosolic or mitochondrial calcium homeostasis. A–D Representative maximum intensity projection images of pLL neuromasts in live 7 dpf Tg(-6myo6b: GCaMP3) fish. The LUT bar in A shows range of intensity values starting at 0 (min) to 2150 (max). E Hair cell cytoGCaMP fluorescence intensity is not affected by dexamethasone exposure. Scatter plots of relative raw integrated density/area values with SEM bars. Each dot represents the average values of neuromasts L3–L5 for one fish. The data show no significant differences in intensity for dexamethasone-treated fish relative to DMSO controls in both intact and regenerating neuromasts. N = 2–3 fish per condition per trial; 5 experimental trials (F–I) Representative maximum intensity projection images of live 7 dpf pLL neuromasts in Tg(-6myo6b: mitoGCaMP3). LUT bar (F) shows range of intensity values starting at 0 (min) to 300 (max). J Hair cell mitoGCaMP fluorescence intensity is not affected by dexamethasone exposure but is elevated in regenerating neuromasts relative to intact neuromasts. Scatter plots of relative raw integrated density/area values with SEM bars. Each dot represents the average values of neuromasts L3–L5 for one fish. The data show no significant differences in intensity for dexamethasone-treated fish relative to DMSO controls in both intact and regenerating neuromasts (adjusted ***P < 0.001 (DMSO), **P < 0.01 (Dex)). N = 2–3 fish per condition per trial; 3 experimental trials |
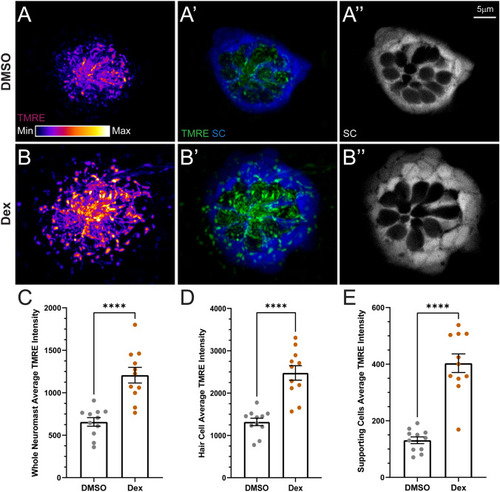
Dexamethasone exposure elevated mitochondrial activity in hair cells and supporting cells. A, B Confocal images of intact pLL neuromasts in live 7 dpf Tg (tnks1bp1:EGFP) fish following TMRE exposure. Fish were treated with DMSO (A) or dexamethasone (B) for 48 h prior to TMRE exposure and imaging. TMRE (A, A′, B, B′) is shown as a max intensity projection and supporting cell (SC) (A′, A″, B′, B″) images are image z-slices from the midlevel of the neuromast. Negative spaces inside GFP-labeled supporting cells indicate neuromast hair cells. LUT bar (A) shows range of intensity values starting at 0 (min) to 11,800 (max). C−E Scatter plots of average TMRE fluorescence intensity (raw integrated density/area values) with SEM bars for whole neuromasts (C), hair cells alone (D), or supporting cells alone (E). Each dot represents the average values of neuromasts L3–L5 for one fish. The data show, compared to DMSO controls, that dexamethasone-treated fish have significantly hyperpolarized mitochondria in both neuromast hair cells and supporting cells (adjusted ****P < 0.0001). N = 1–4 fish per condition per trial; 5 experimental trials |

Dexamethasone exposure increased hair cell sensitivity to neomycin.A–J Representative maximum intensity images of fixed pLL neuromasts with DAPI-labeled hair cell nuclei (blue). Larvae (7 dpf) were exposed for 48 h to DMSO (carrier) alone (A–E) or dexamethasone (F–J), then exposed for 30 min or 10 µM (B, G), 30 µM (C, H), 50 µM (D, I), or 100 µM (E, J) neomycin. EM buffer alone was used as a control (A, F). K Dose–response curve with mean and SEM bars shows the number of hair cells per neuromast as a percent of those present in unlesioned controls. Dexamethasone-treated neuromast hair cells were more sensitive to neomycin-induced cell death than controls (adjusted *P < 0.05 (50 µM), ****P < 0.0001 (100 µM)). N = 7 fish per condition per trial; 3 experimental trials |
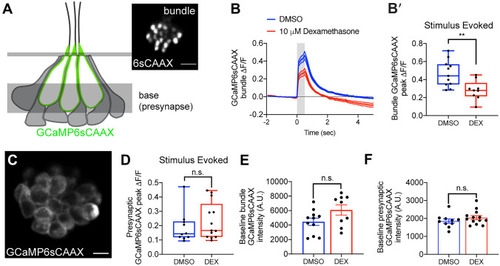
Dexamethasone exposure decreased evoked mechanosensation but not presynaptic calcium responses. A Schematic of a neuromast viewed from the side, and the imaging planes used to measure evoked calcium activity at the hair bundles and at the presynaptic region. Localization of GCaMP6sCAAX is shown in green. Inset shows an example of a top-down view of the hair bundle plane showing GCaMP6sCAAX fluorescence. B, B′ Evoked hair bundle calcium signal with (red) or without (blue) 48 h dexamethasone pretreatment. Average traces are shown in B, while dot plots of peak response of bundles per neuromast are shown in B′. C Top-down view of the basal plane showing the presynaptic membrane labeled with GCaMP6sCAAX. D Dot plots show that the peak evoked presynaptic calcium signal averaged per neuromast with (red) and without (blue) 48 h dexamethasone pretreatment. E, F Baseline calcium intensity with (red) and without (blue) dexamethasone treatment in hair bundles (E) and presynapses (F). Shaded area above and below traces in panel B and error bars in E and F represent SEM. Box-and-whiskers plot were used in B′ and D to show median, min and max. An unpaired Welch’s unequal variance t-test was used to calculate the significance of differences in B′ and D. An unpaired t-test was used to calculate the significance of differences in E and F. n ≥ 9 neuromasts per treatment. **P < 0.01. Scale bar = 5 µm in A inset and C |