
- Title
-
Oxytocin promotes epicardial cell activation and heart regeneration after cardiac injury
- Authors
- Wasserman, A.H., Huang, A.R., Lewis-Israeli, Y.R., Dooley, M.D., Mitchell, A.L., Venkatesan, M., Aguirre, A.
- Source
- Full text @ Front Cell Dev Biol
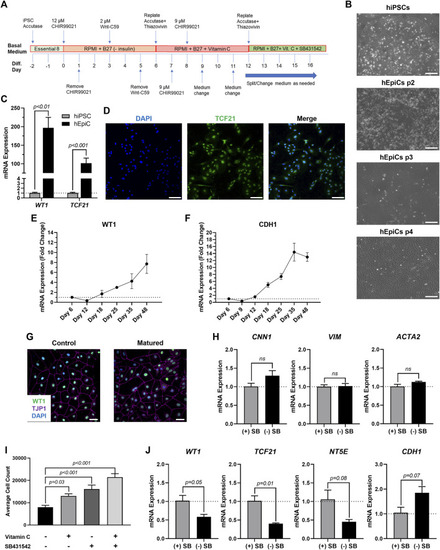
Differentiation of Mature-Like Epicardial Cell Cultures from hiPSCs. (A) Schematic of protocol used for hEpiC differentiation. (B) Brightfield images of hEpiCs through four passages showing the gradual accumulation of the classic epithelial cell cobblestone morphology; scale bar: 500 µm. (C) qRT-PCR data for epicardial markers WT1 and TCF21 in hiPSCs and hEpiCs; n = 4-6 per cell line. (D) Confocal immunofluorescent images for TCF21 (green) and DAPI (blue) showing nearly 100% epicardial differentiation efficiency from hiPSCs; scale bar: 100 µm. (E,F) Time course qRT-PCR data for WT1 (E) and CDH1 (F) throughout hEpiC differentiation, suggesting an increase in epicardial nature over time; n = 3 per time point. (G) Confocal immunofluorescent images showing robust expression of epithelial markers after removal of Vitamin C and SB431542 from the culture media. Epicardial cells are labeled with WT1 (green), epithelial membranes with TJP1 (magenta), nuclei with DAPI (blue); scale bar: 50 µm. (H) qRT-PCR data for hEpiCs in the presence or absence of SB431542, showing no change in smooth muscle or fibroblast differentiation; n = 3 per condition. (I) Absolute counts of DAPI-labeled nuclei after exposure to different combinations of Vitamin C and SB431542; n > 20 per condition. (J) qRT-PCR data for hEpiCs in the presence or absence of SB431542 (SB), showing an increase in maturity when this compound is removed from the media; n = 3 per condition. |
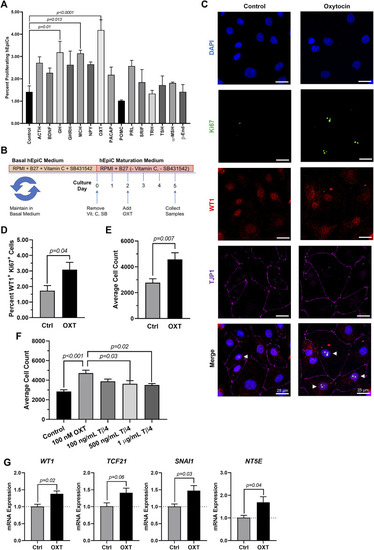
Oxytocin Induces Proliferation and Activation of hiPSC-Derived Epicardial Cells. (A) Screening results for 15 candidate neuroendocrine peptides, shown as the percentage of hEpiCs expressing H3P after exposure to each compound; n = 3 per condition. (B) Experimental timeline used to quantify OXT-induced epicardial activation. (C,D) Confocal immunofluorescent images (C) and quantification (D) of proliferating hEpiCs after 3 days OXT exposure. In (C), epicardial cells are labeled with WT1 (red), epithelial membranes are labeled with TJP1 (magenta), proliferating cells (arrowheads) are labeled with Ki67 (green), nuclei are labeled with DAPI (blue); n = 6 images per condition, scale bar: 25 µm. (E,F) Absolute counts of DAPI-labeled epicardial cell nuclei after 3 days exposure to OXT (E) or thymosin β4 (F), a compound previously shown to induce epicardial activation; n ≥ 6 per condition. (G) qRT-PCR data for epicardial cells exposed to OXT, showing an increase in EpiPC (WT1, TCF21), EMT (SNAI1), and mesenchymal (NT5E) markers; n = 4 per condition. |

OXTR Knockdown Decreases Proliferation and Activation of hiPSC-Derived Epicardial Cells. (A) Dose-response data for hEpiCs exposed to different concentrations of OXT over the course of 3 days, expressed as number of nuclei at each concentration; n = 10 per concentration. (B) Time course qRT-PCR data for OXTR in hEpiCs, dashed line corresponds to expression in undifferentiated hiPSCs. (C) Confocal immunofluorescent images for OXTR (green) and DAPI (blue) showing oxytocin receptor expression on the cell membrane and in the peri-nuclear region only in hEpiCs; scale bar: 25 µm. (D,E) Confocal immunofluorescent images (D) and quantification (E) of proliferating hEpiCs in both cell lines in the presence and absence of OXT at day 25 of differentiation. In (D), epicardial cells are labeled with WT1 (red), epithelial membranes are labeled with TJP1 (magenta), proliferating cells are labeled with Ki67 (green), nuclei are labeled with DAPI (blue); n = 10 images per condition, scale bar: 50 µm. (F) qRT-PCR data for scrambled and shOXTR hEpiCs, showing an increase in epicardial activation in control cells that is prevented after OXTR knockdown; n = 6 per condition, V: Vehicle. |
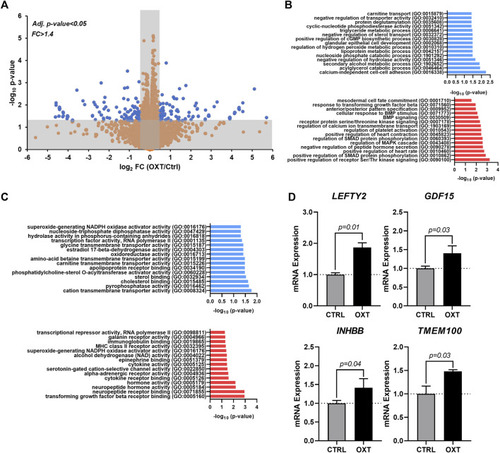
Transcriptome Analysis of Oxytocin-Treated Human Epicardial Cells. (A) Volcano plot showing differentially expressed genes between control and OXT-treated hEpiCs, as determined by RNA sequencing; Blue dots correspond to genes with a fold change ≥1.4 and a p-value ≤ 0.05. (B,C) Gene ontology analysis showing upregulated and downregulated biological processes (B) and molecular functions (C) after oxytocin exposure in hEpiCs. (D) Relative mRNA expression of ligands for the TGF-β pathway and activators of BMP signaling in control and OXT-treated hEpiCs; n = 3 per condition. |
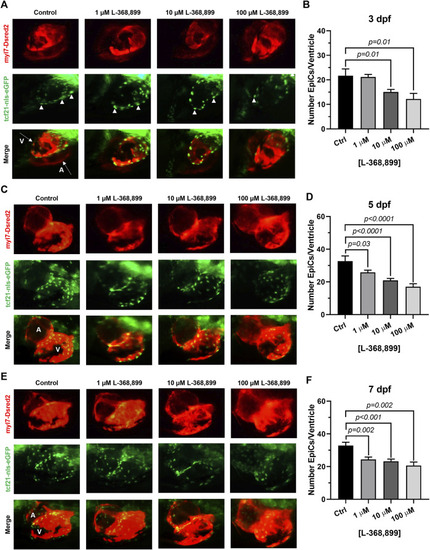
Oxytocin Signaling is Necessary for Epicardium Development in Zebrafish. (A–F) Fluorescent images (A,C,E) and epicardial cell counts per ventricle (B,D,F) of developing zebrafish embryos at 3, 5, and 7 dpf treated with different concentrations of L-368,899. In (A) (C), and (E) proepicardial and epicardial cell nuclei are labeled with GFP (tcf21-nls-eGFP, arrowheads), myocardium is labeled with DsRed2 (red); n ≥ 5 embryos per condition for each time point; (A) Atrium, dpf: Days Post-Fertilization, V: Ventricle. |
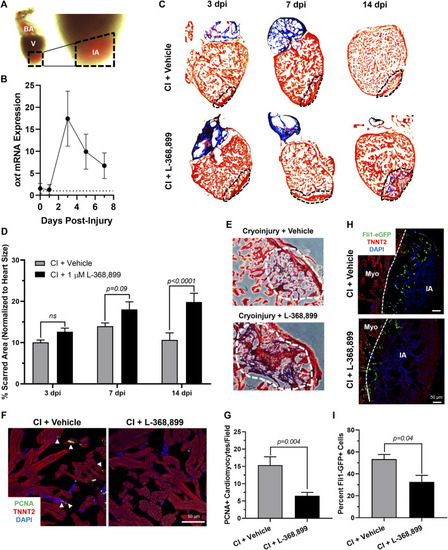
Oxytocin Signaling is Necessary for Proper Heart Regeneration in Zebrafish. (A) Example of a freshly cryoinjured zebrafish heart, dashed lines demarcate injured area. (B) Time course qRT-PCR data for oxt in zebrafish brains after cardiac cryoinjury; n = 3 per time point. (C,D) Masson’s trichrome staining (C) and quantification (D) of cryoinjured zebrafish hearts at 3, 7, and 14 dpi treated with and without 1 µM L-368,899. In (C), myocardium is stained red, collagen is stained blue, dashed lines demarcate injured area, which is quantified in (D); n = 3–5 hearts per time point. (E) Representative images of cryoinjured zebrafish myocardium (red) at 14 dpi showing more fibrosis accumulation (blue) after OXTR inhibition. Dashed lines demarcate fibrotic area. (F–G) Confocal immunofluorescent images (F) and quantification (G) of proliferating cardiomyocytes in cryoinjured zebrafish hearts at 3 dpi adjacent to injured areas. In (F), cardiomyocytes are labeled with TNNT2 (red), proliferating cells (arrowheads) with PCNA (green), nuclei with DAPI (blue); n = 8 images per condition, scale bar: 50 µm. (H–I) Confocal immunofluorescent images (H) and quantification (I) of fli1-eGFP transgenic zebrafish at 3 dpi showing endothelial revascularization in cryoinjured and L-368,899-treated hearts. In (H), endothelial and endocardial cells are labeled with GFP (green), cardiomyocytes with TNNT2 (red), nuclei with DAPI (blue); n = 3,4 images per condition, scale bar: 50 μm; BA: Bulbus Arteriosus, CI: Cryoinjury, CM: Cardiomyocyte, dpi: Days Post-Injury, IA: Injured Area, Myo: Myocardium, V: Ventricle. |
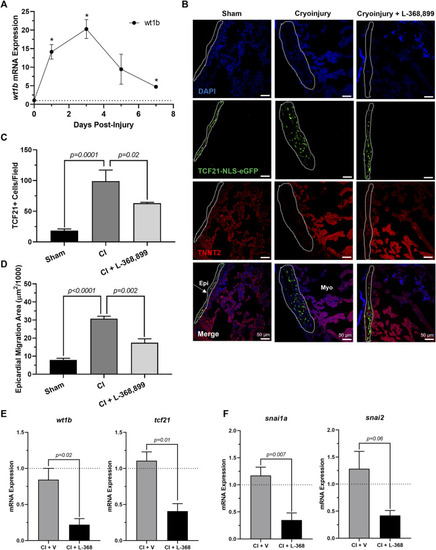
Inhibition of Oxytocin Signaling Prevents Epicardial Activation After Zebrafish Cardiac Injury. (A) Time course qRT-PCR data for wt1b in zebrafish hearts after cardiac cryoinjury; *p < 0.05 versus sham operated heart; n = 3 per time point. (B–D) Confocal immunofluorescent images (B) and quantification (C–D) of tcf21-nls-eGFP transgenic zebrafish at 3 dpi showing epicardial activation and expansion in sham, cryoinjured, and L-368,899-treated hearts. In (B), epicardial cell nuclei are labeled with GFP (green), cardiomyocytes are labeled with TNNT2 (red), nuclei are labeled with DAPI (blue); n = 3–5 images per condition, scale bar: 50 µm. (E–F) qRT-PCR data for wt1b and tcf21 (E) and snai1a and snai2 (F) in cryoinjured zebrafish hearts at 3 dpi treated with and without 1 µM L-368,899 (L-368); n = 3–5 per condition; CI: Cryoinjury, dpi: Days Post-Injury, Epi: Epicardium, Myo: Myocardium, V: Vehicle. |