
FIGURE
FIGURE 4
- ID
- ZDB-FIG-221018-74
- Publication
- Wasserman et al., 2022 - Oxytocin promotes epicardial cell activation and heart regeneration after cardiac injury
- Other Figures
- All Figure Page
- Back to All Figure Page
FIGURE 4
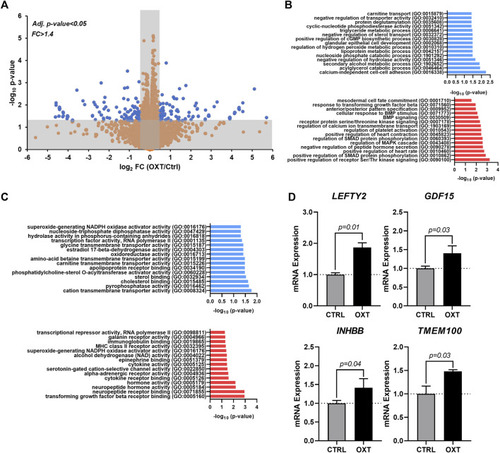
Transcriptome Analysis of Oxytocin-Treated Human Epicardial Cells. (A) Volcano plot showing differentially expressed genes between control and OXT-treated hEpiCs, as determined by RNA sequencing; Blue dots correspond to genes with a fold change ≥1.4 and a p-value ≤ 0.05. (B,C) Gene ontology analysis showing upregulated and downregulated biological processes (B) and molecular functions (C) after oxytocin exposure in hEpiCs. (D) Relative mRNA expression of ligands for the TGF-β pathway and activators of BMP signaling in control and OXT-treated hEpiCs; n = 3 per condition. |
Expression Data
Expression Detail
Antibody Labeling
Phenotype Data
Phenotype Detail
Acknowledgments
This image is the copyrighted work of the attributed author or publisher, and
ZFIN has permission only to display this image to its users.
Additional permissions should be obtained from the applicable author or publisher of the image.
Full text @ Front Cell Dev Biol