
|
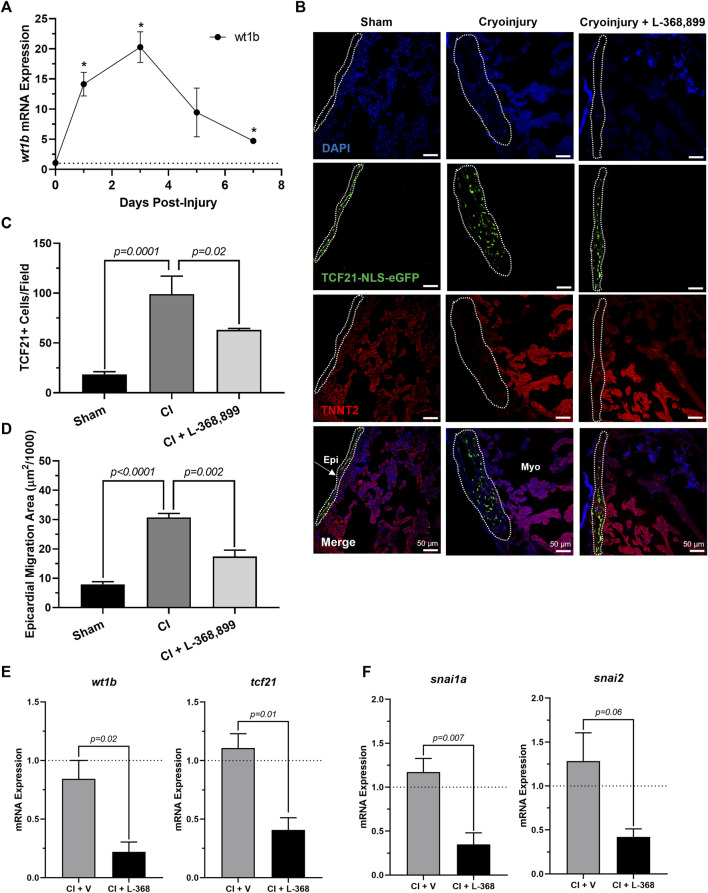
FIGURE 7
Inhibition of Oxytocin Signaling Prevents Epicardial Activation After Zebrafish Cardiac Injury. (A) Time course qRT-PCR data for wt1b in zebrafish hearts after cardiac cryoinjury; *p < 0.05 versus sham operated heart; n = 3 per time point. (B–D) Confocal immunofluorescent images (B) and quantification (C–D) of tcf21-nls-eGFP transgenic zebrafish at 3 dpi showing epicardial activation and expansion in sham, cryoinjured, and L-368,899-treated hearts. In (B), epicardial cell nuclei are labeled with GFP (green), cardiomyocytes are labeled with TNNT2 (red), nuclei are labeled with DAPI (blue); n = 3–5 images per condition, scale bar: 50 µm. (E–F) qRT-PCR data for wt1b and tcf21 (E) and snai1a and snai2 (F) in cryoinjured zebrafish hearts at 3 dpi treated with and without 1 µM L-368,899 (L-368); n = 3–5 per condition; CI: Cryoinjury, dpi: Days Post-Injury, Epi: Epicardium, Myo: Myocardium, V: Vehicle.