
- Title
-
Hyperactive Akt1 Signaling Increases Tumor Progression and DNA Repair in Embryonal Rhabdomyosarcoma RD Line and Confers Susceptibility to Glycolysis and Mevalonate Pathway Inhibitors
- Authors
- Codenotti, S., Zizioli, D., Mignani, L., Rezzola, S., Tabellini, G., Parolini, S., Giacomini, A., Asperti, M., Poli, M., Mandracchia, D., Vezzoli, M., Bernardi, S., Russo, D., Mitola, S., Monti, E., Triggiani, L., Tomasini, D., Gastaldello, S., Cassandri, M., Rota, R., Marampon, F., Fanzani, A.
- Source
- Full text @ Cells
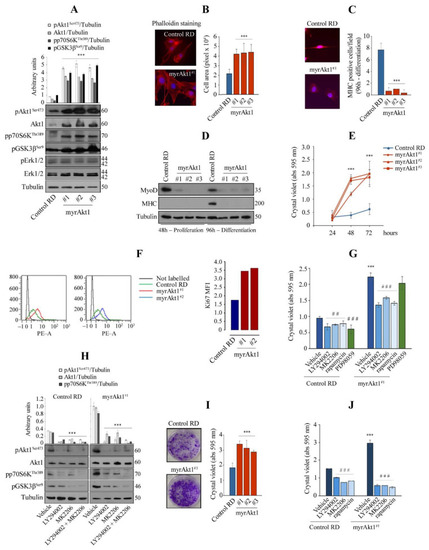
Analysis of cell differentiation and growth in the RD line expressing a myrAkt1 form. (A) Control and myrAkt1 cells (1.5 × 10⁵), seeded into 60 mm dishes, were left to proliferate for 48 h before collecting protein samples. Activation of Akt1 signaling was determined by IB with the indicated antibodies (n = 2). Data are mean ± SEM, *** p-value < 0.0001; one-way Anova test. (B) Under the same conditions seen above, cells were seeded on coverslips and stained with fluorescent red phalloidin. Representative images were taken using a fluorescent microscope at 63× magnification (n = 2). Quantification of the cell area was calculated by using ImagePro Plus software. Data are mean ± SEM, *** p-value < 0.0001; one-way Anova test. (C) Control and myrAkt1 cells (2 × 10⁵), seeded onto coverslips in 60 mm dishes, were left to proliferate until reaching confluence (48 h), before treatment with DM (up to 96 h). Then, MHC staining was analyzed by IF. Reported quantification is relative to the average number of MHC-positive cells resulting from at least 10 different fields (n = 2). Data are mean ± SEM, *** p-value < 0.0001; unpaired Student’s t-test. (D) IB for detection of MyoD and MHC was performed on proliferating and differentiating cells at the indicated times, respectively (n = 2). (E) After seeding the cells (1.5 × 10⁴) in 24-multiwell plates, the cell growth was evaluated over a time-course by crystal violet incorporation (n = 3). Data are mean ± SEM, *** p-value < 0.0001; one-way Anova test. (F) Control and myrAkt1 cells (1 × 10⁵) were seeded into 100 mm dishes and left to proliferate for 24 h in GM before starvation with a GM supplemented with 5% FBS. Ki67 quantitative fluorescence was measured in sorted cells after 72 h by FACS analysis (n = 2). (G) Control and myrAkt1 cells (1.5 × 10⁴), seeded in 24-multiwell plates, were left to proliferate in GM for 24 h before acute treatment with 10 µM LY294002, 10 µM MK2206, 100 nM rapamycin, 10 µM PD98059, or DMSO vehicle. After 72 h of cell growth, crystal violet incorporation was quantified (n = 3). Data are mean ± SEM, *** p-value < 0.0001; unpaired Student’s t-test vs. control RD line. ## p-value < 0.001; ### p-value < 0.0001; one-way Anova test vs. DMSO-treated cells. (H) Control and myrAkt1 cells (1.5 × 10⁵), seeded into 60 mm dishes, were maintained for 24 h in GM before acute treatment with 10 µM LY294002, 10 µM MK2206, a combination of 5 µM LY294002 and 5 µM MK2206 or a DMSO vehicle. Activation of Akt1 signaling was determined by IB with the indicated antibodies after 72 h (n = 2). Data are mean ± SEM, *** p-value < 0.0001; one-way Anova test. (I) Pictures showing the clonogenic capacity of control and myrAkt1 cells. Single colonies were left to grow for 10 days in 6-multiwell plates prior to crystal violet incorporation (for details, see Material and Methods). The graph (right panel) shows the crystal violet quantification (n = 3). Data are mean ± SEM, *** p-value < 0.0001; one-way Anova test. (J) Cell growth was evaluated by clonogenic assay after 2-h pretreatment with 10 µM LY294002, 10 µM MK2206, 100 nM rapamycin, or a DMSO vehicle. Quantification was performed by crystal violet incorporation (n = 2). Data are mean ± SEM, *** p-value < 0.0001; unpaired Student’s t-test vs control RD line. ### p-value < 0.0001; one-way Anova test vs. DMSO-treated cells. |
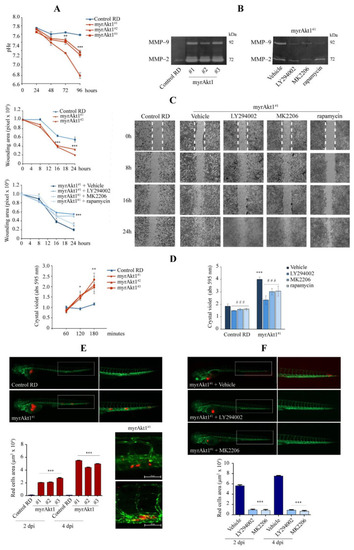
Analysis of cell invasion and migration by in vitro and in vivo assays. (A) Control and myrAkt1 cells (6 × 10⁴) were seeded into 6-multiwell plates and left to proliferate up to 96 h. At the indicated time points, the medium pH was measured (n = 2). Data are mean ± SEM, ** p-value < 0.001; *** p-value < 0.0001; one-way Anova test. (B) Gel zymogram depicting differences in MMP-2 and -9 content between control and myrAkt1 cells (left panel) (n = 2). MMP-2 and -9 expression was also assessed in myrAkt1 cells pre-treated with 10 µM LY294002, 10 µM MK2206, or 100 nM rapamycin for 24 h (right panel) (n = 2). (C) The migration capacity of control and myrAkt1 cells was evaluated by wound healing assay over a time course of 24 h (top graph). The increased migratory cell behavior of myrAkt1 cells was evaluated after 2 h-pretreatment with 10 µM LY294002, 10 µM MK2206, 100 nM rapamycin, or DMSO vehicle (bottom graph) (n = 3). Representative pictures showing the migration front were taken at 10x magnification. The edges of the wound at time 0 h are identified as dotted white lines. Data are mean ± SEM, *** p-value < 0.0001; one-way Anova test. (D) After seeding control and myrAkt1 cells in 24-multiwell plates (3 × 10⁴), cell adhesion was evaluated by crystal violet in the absence or presence of 2 h pre-treatment with 10 µM LY294002, 10 µM MK2206, 100 nM rapamycin, or a DMSO vehicle (left and right graphs, respectively) (n = 2). Data are mean ± SEM, * p-value < 0.05; ** p-value < 0.001; *** p-value < 0.0001; unpaired Student’s t-test vs. control RD line. ### p-value < 0.0001; one-way Anova test vs. DMSO-treated cells. (E) CM-Dil fluorescent labeled control and myrAkt1 cells (~250) were engrafted into the yolk sac of zebrafish embryos. Representative images of cell dissemination were taken after 4 dpi using a fluorescent Axio Zoom V16 microscope at 20× and 32× magnification. Quantification of migrated tumor cells was calculated after 2 and 4 dpi by using Noldus DanioScope TM software (n = 3). Data are mean ± SEM, *** p-value < 0.0001; one-way Anova test. (F) Fluorescent labeled myrAkt1 cells were pretreated with 10 µM LY294002, 10 µM MK2206 or DMSO vehicle 24 h prior to yolk injection into zebrafish embryos. Xenografted embryos were maintained in water added with 2.5 µM LY294002, 5 µM MK2206, or DMSO vehicle until 4 dpi. Representative images were taken after 4 dpi at 20× and 32× magnification. Quantification of migrated tumor cells was calculated after 2 and 4 dpi (n = 2). Data are mean ± SEM, *** p-value < 0.0001; one-way Anova test. |
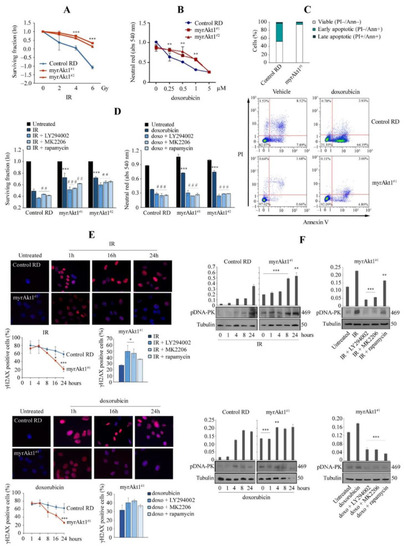
Analysis of apoptosis and DNA damage mechanisms in response to genotoxic stress agents. (A) Control and myrAkt1 cells (2 × 10⁵), seeded into 60 mm dishes, were left 24 h in GM and then exposed to increasing IR doses. Quantification of colony formation by a crystal violet assay was expressed as a natural logarithm, setting control to 1 (n = 3). Data are mean ± SEM, *** p-value < 0.0001; one-way Anova test. (B) Neutral red assay was performed to measure cell viability in control and myrAkt1 clones treated for 48 h with increasing doxorubicin doses (n = 3). Data are mean ± SEM, ** p-value < 0.001; one-way Anova test. (C) Cells (1 × 10⁵) were seeded into 6-multiwell plates. After 24 h, cells were treated with 1 µM doxorubicin or DMSO vehicle. After 48 h, cells were stained with PI and Annexin V. The percentages of viable, early, and late apoptotic cells were calculated by FACS analysis and are reported in the graph (n = 2). (D) Clonogenic and neutral red assays (left and right graphs, respectively) were performed to measure viability of cells preincubated for 2 h with 10 µM LY294002, 10 µM MK2206, 100 nM rapamycin, or the DMSO vehicle before irradiation (4 Gy) and doxorubicin treatment (1 µM) (n = 3). Data are mean ± SEM, *** p-value < 0.0001; unpaired Student’s t-test vs. control RD cells. ## p-value < 0.001; ### p-value < 0.0001; one-way Anova test vs. DMSO-treated cells. (E) Control and myrAkt1 cells (1.5 × 10⁵), seeded onto coverslips in 60 mm dishes, were left to proliferate in GM for 48 h before irradiation (4 Gy) or treatment with doxorubicin (1 µM). Nuclear γH2AX staining was evaluated by IF analysis over a time course of 24 h. Representative images were taken at 63× magnification. The reported quantification in the bottom left graphs is relative to the average number of γH2AX-positive cells counted in 10 different fields (n = 2). As reported in the bottom right graphs, nuclear γH2AX staining was evaluated in cells pre-treated with 10 μM LY294002, 10 μM MK2206, 100 nM rapamycin, or the DMSO vehicle for 2 h before irradiation (4 Gy) or administration of doxorubicin (1 µM) (n = 2). Data are mean ± SEM, * p-value < 0.05; *** p-value < 0.0001; unpaired Student’s t-test. (F) Control and myrAkt1 cells (1.5 × 10⁵), seeded into 60 mm dishes, were left to proliferate in GM for 48 h before irradiation (4 Gy) (top panel) or treatment with doxorubicin (1 µM) (bottom panel). At the indicated time points, cells were harvested, and protein homogenates were blotted to perform IB for pDNA-PK (n = 2). Under the same conditions seen above, cells were pre-treated with 10 μM LY294002, 10 μM MK2206, 100 nM rapamycin, or the DMSO vehicle for 2 h prior to irradiation (4 Gy) (left panel) or doxorubicin administration (1 µM) (right panel). IB was performed using protein homogenates from cells harvested after 8 h (n = 2). Data are mean ± SEM, ** p-value < 0.001; *** p-value < 0.0001; unpaired Student’s t-test. |

Effects of 2-DG and lovastatin on cell survival, cell dissemination, and radio- and chemotherapy. (A) Neutral red assay was performed to measure cell viability in control and myrAkt1 clones treated for 48 h with increasing 2-DG and lovastatin doses (n = 3). Data are mean ± SEM, ** p-value < 0.001; *** p-value < 0.0001; one-way Anova test. (B) Cells (1 × 10⁵) were seeded into 6-multiwell plates. After 24 h, cells were treated with 2 mM 2-DG and 10 µM lovastatin or DMSO vehicle. After 48 h, cells were stained with PI and Annexin V. The percentages of viable, early, and late apoptotic cells were calculated by FACS analysis and are reported in the graph (n = 2). (C) Gel zymogram depicting differences in MMP-2 and -9 expression in myrAkt1 cells treated with 2 mM 2-DG and 10 µM lovastatin or DMSO vehicle for 24 h (n = 2). (D) MyrAkt1 cells were pre-treated for 2 h with 2 mM 2-DG and 10 µM lovastatin or DMSO vehicle before wound induction. As depicted in the graph, the wound repair area was evaluated over a time-course of 24 h. Representative images were taken after 24 h (n = 2). Data are mean ± SEM, * p-value < 0.05; *** p-value < 0.0001; one-way Anova test. (E) CM-Dil fluorescent labeled myrAkt1 cells were pretreated with 2 mM 2-DG, 10 µM lovastatin or DMSO vehicle 24 h prior to yolk injection into zebrafish embryos. Xenografted embryos were maintained in water added with 50 µM 2-DG, 0.1 µM lovastatin, or the DMSO vehicle. Representative images were taken after 4 dpi at 20× and 32× magnification. Quantification of migrated tumor cells was calculated at 2 and 4 dpi (n = 3). Data are mean ± SEM, *** p-value < 0.0001; one-way Anova test. (F) Clonogenic and neutral red assays (left and right graphs, respectively) were performed to measure viability of cells preincubated for 2 h with 2 mM 2-DG, 10 µM lovastatin, or the DMSO vehicle before irradiation (4 Gy) and doxorubicin treatment (1 µM) (n = 3). Data are mean ± SEM, ** p-value < 0.001; *** p-value < 0.0001; one-way Anova test. |