
Fig. 2
- ID
- ZDB-FIG-220926-65
- Publication
- Codenotti et al., 2022 - Hyperactive Akt1 Signaling Increases Tumor Progression and DNA Repair in Embryonal Rhabdomyosarcoma RD Line and Confers Susceptibility to Glycolysis and Mevalonate Pathway Inhibitors
- Other Figures
- All Figure Page
- Back to All Figure Page
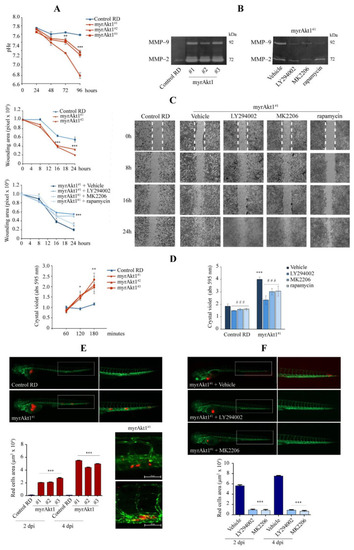
Analysis of cell invasion and migration by in vitro and in vivo assays. (A) Control and myrAkt1 cells (6 × 10⁴) were seeded into 6-multiwell plates and left to proliferate up to 96 h. At the indicated time points, the medium pH was measured (n = 2). Data are mean ± SEM, ** p-value < 0.001; *** p-value < 0.0001; one-way Anova test. (B) Gel zymogram depicting differences in MMP-2 and -9 content between control and myrAkt1 cells (left panel) (n = 2). MMP-2 and -9 expression was also assessed in myrAkt1 cells pre-treated with 10 µM LY294002, 10 µM MK2206, or 100 nM rapamycin for 24 h (right panel) (n = 2). (C) The migration capacity of control and myrAkt1 cells was evaluated by wound healing assay over a time course of 24 h (top graph). The increased migratory cell behavior of myrAkt1 cells was evaluated after 2 h-pretreatment with 10 µM LY294002, 10 µM MK2206, 100 nM rapamycin, or DMSO vehicle (bottom graph) (n = 3). Representative pictures showing the migration front were taken at 10x magnification. The edges of the wound at time 0 h are identified as dotted white lines. Data are mean ± SEM, *** p-value < 0.0001; one-way Anova test. (D) After seeding control and myrAkt1 cells in 24-multiwell plates (3 × 10⁴), cell adhesion was evaluated by crystal violet in the absence or presence of 2 h pre-treatment with 10 µM LY294002, 10 µM MK2206, 100 nM rapamycin, or a DMSO vehicle (left and right graphs, respectively) (n = 2). Data are mean ± SEM, * p-value < 0.05; ** p-value < 0.001; *** p-value < 0.0001; unpaired Student’s t-test vs. control RD line. ### p-value < 0.0001; one-way Anova test vs. DMSO-treated cells. (E) CM-Dil fluorescent labeled control and myrAkt1 cells (~250) were engrafted into the yolk sac of zebrafish embryos. Representative images of cell dissemination were taken after 4 dpi using a fluorescent Axio Zoom V16 microscope at 20× and 32× magnification. Quantification of migrated tumor cells was calculated after 2 and 4 dpi by using Noldus DanioScope TM software (n = 3). Data are mean ± SEM, *** p-value < 0.0001; one-way Anova test. (F) Fluorescent labeled myrAkt1 cells were pretreated with 10 µM LY294002, 10 µM MK2206 or DMSO vehicle 24 h prior to yolk injection into zebrafish embryos. Xenografted embryos were maintained in water added with 2.5 µM LY294002, 5 µM MK2206, or DMSO vehicle until 4 dpi. Representative images were taken after 4 dpi at 20× and 32× magnification. Quantification of migrated tumor cells was calculated after 2 and 4 dpi (n = 2). Data are mean ± SEM, *** p-value < 0.0001; one-way Anova test. |