
Fig. 3
- ID
- ZDB-FIG-220926-66
- Publication
- Codenotti et al., 2022 - Hyperactive Akt1 Signaling Increases Tumor Progression and DNA Repair in Embryonal Rhabdomyosarcoma RD Line and Confers Susceptibility to Glycolysis and Mevalonate Pathway Inhibitors
- Other Figures
- All Figure Page
- Back to All Figure Page
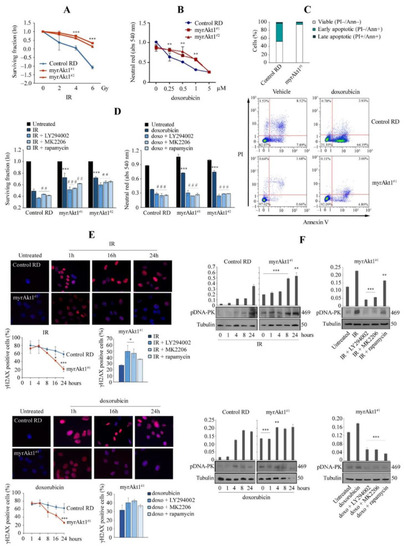
Analysis of apoptosis and DNA damage mechanisms in response to genotoxic stress agents. (A) Control and myrAkt1 cells (2 × 10⁵), seeded into 60 mm dishes, were left 24 h in GM and then exposed to increasing IR doses. Quantification of colony formation by a crystal violet assay was expressed as a natural logarithm, setting control to 1 (n = 3). Data are mean ± SEM, *** p-value < 0.0001; one-way Anova test. (B) Neutral red assay was performed to measure cell viability in control and myrAkt1 clones treated for 48 h with increasing doxorubicin doses (n = 3). Data are mean ± SEM, ** p-value < 0.001; one-way Anova test. (C) Cells (1 × 10⁵) were seeded into 6-multiwell plates. After 24 h, cells were treated with 1 µM doxorubicin or DMSO vehicle. After 48 h, cells were stained with PI and Annexin V. The percentages of viable, early, and late apoptotic cells were calculated by FACS analysis and are reported in the graph (n = 2). (D) Clonogenic and neutral red assays (left and right graphs, respectively) were performed to measure viability of cells preincubated for 2 h with 10 µM LY294002, 10 µM MK2206, 100 nM rapamycin, or the DMSO vehicle before irradiation (4 Gy) and doxorubicin treatment (1 µM) (n = 3). Data are mean ± SEM, *** p-value < 0.0001; unpaired Student’s t-test vs. control RD cells. ## p-value < 0.001; ### p-value < 0.0001; one-way Anova test vs. DMSO-treated cells. (E) Control and myrAkt1 cells (1.5 × 10⁵), seeded onto coverslips in 60 mm dishes, were left to proliferate in GM for 48 h before irradiation (4 Gy) or treatment with doxorubicin (1 µM). Nuclear γH2AX staining was evaluated by IF analysis over a time course of 24 h. Representative images were taken at 63× magnification. The reported quantification in the bottom left graphs is relative to the average number of γH2AX-positive cells counted in 10 different fields (n = 2). As reported in the bottom right graphs, nuclear γH2AX staining was evaluated in cells pre-treated with 10 μM LY294002, 10 μM MK2206, 100 nM rapamycin, or the DMSO vehicle for 2 h before irradiation (4 Gy) or administration of doxorubicin (1 µM) (n = 2). Data are mean ± SEM, * p-value < 0.05; *** p-value < 0.0001; unpaired Student’s t-test. (F) Control and myrAkt1 cells (1.5 × 10⁵), seeded into 60 mm dishes, were left to proliferate in GM for 48 h before irradiation (4 Gy) (top panel) or treatment with doxorubicin (1 µM) (bottom panel). At the indicated time points, cells were harvested, and protein homogenates were blotted to perform IB for pDNA-PK (n = 2). Under the same conditions seen above, cells were pre-treated with 10 μM LY294002, 10 μM MK2206, 100 nM rapamycin, or the DMSO vehicle for 2 h prior to irradiation (4 Gy) (left panel) or doxorubicin administration (1 µM) (right panel). IB was performed using protein homogenates from cells harvested after 8 h (n = 2). Data are mean ± SEM, ** p-value < 0.001; *** p-value < 0.0001; unpaired Student’s t-test. |