
|
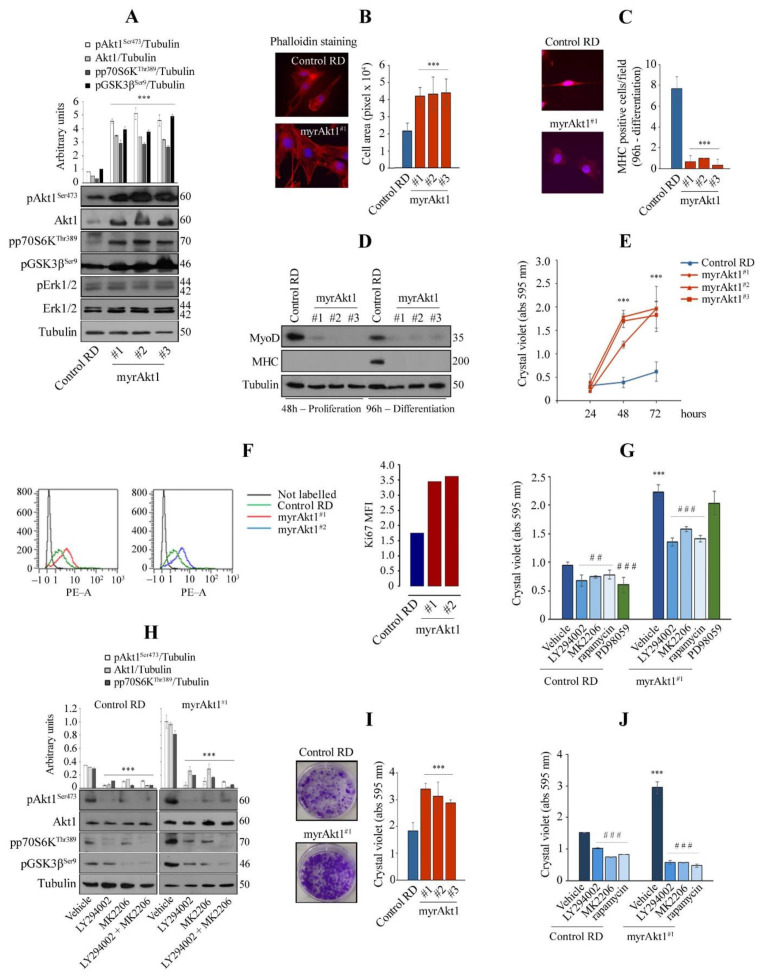
Fig. 1
Analysis of cell differentiation and growth in the RD line expressing a myrAkt1 form. (A) Control and myrAkt1 cells (1.5 × 10⁵), seeded into 60 mm dishes, were left to proliferate for 48 h before collecting protein samples. Activation of Akt1 signaling was determined by IB with the indicated antibodies (n = 2). Data are mean ± SEM, *** p-value < 0.0001; one-way Anova test. (B) Under the same conditions seen above, cells were seeded on coverslips and stained with fluorescent red phalloidin. Representative images were taken using a fluorescent microscope at 63× magnification (n = 2). Quantification of the cell area was calculated by using ImagePro Plus software. Data are mean ± SEM, *** p-value < 0.0001; one-way Anova test. (C) Control and myrAkt1 cells (2 × 10⁵), seeded onto coverslips in 60 mm dishes, were left to proliferate until reaching confluence (48 h), before treatment with DM (up to 96 h). Then, MHC staining was analyzed by IF. Reported quantification is relative to the average number of MHC-positive cells resulting from at least 10 different fields (n = 2). Data are mean ± SEM, *** p-value < 0.0001; unpaired Student’s t-test. (D) IB for detection of MyoD and MHC was performed on proliferating and differentiating cells at the indicated times, respectively (n = 2). (E) After seeding the cells (1.5 × 10⁴) in 24-multiwell plates, the cell growth was evaluated over a time-course by crystal violet incorporation (n = 3). Data are mean ± SEM, *** p-value < 0.0001; one-way Anova test. (F) Control and myrAkt1 cells (1 × 10⁵) were seeded into 100 mm dishes and left to proliferate for 24 h in GM before starvation with a GM supplemented with 5% FBS. Ki67 quantitative fluorescence was measured in sorted cells after 72 h by FACS analysis (n = 2). (G) Control and myrAkt1 cells (1.5 × 10⁴), seeded in 24-multiwell plates, were left to proliferate in GM for 24 h before acute treatment with 10 µM LY294002, 10 µM MK2206, 100 nM rapamycin, 10 µM PD98059, or DMSO vehicle. After 72 h of cell growth, crystal violet incorporation was quantified (n = 3). Data are mean ± SEM, *** p-value < 0.0001; unpaired Student’s t-test vs. control RD line. ## p-value < 0.001; ### p-value < 0.0001; one-way Anova test vs. DMSO-treated cells. (H) Control and myrAkt1 cells (1.5 × 10⁵), seeded into 60 mm dishes, were maintained for 24 h in GM before acute treatment with 10 µM LY294002, 10 µM MK2206, a combination of 5 µM LY294002 and 5 µM MK2206 or a DMSO vehicle. Activation of Akt1 signaling was determined by IB with the indicated antibodies after 72 h (n = 2). Data are mean ± SEM, *** p-value < 0.0001; one-way Anova test. (I) Pictures showing the clonogenic capacity of control and myrAkt1 cells. Single colonies were left to grow for 10 days in 6-multiwell plates prior to crystal violet incorporation (for details, see Material and Methods). The graph (right panel) shows the crystal violet quantification (n = 3). Data are mean ± SEM, *** p-value < 0.0001; one-way Anova test. (J) Cell growth was evaluated by clonogenic assay after 2-h pretreatment with 10 µM LY294002, 10 µM MK2206, 100 nM rapamycin, or a DMSO vehicle. Quantification was performed by crystal violet incorporation (n = 2). Data are mean ± SEM, *** p-value < 0.0001; unpaired Student’s t-test vs control RD line. ### p-value < 0.0001; one-way Anova test vs. DMSO-treated cells.