
- Title
-
Nodal signaling regulates asymmetric cellular behaviors, driving clockwise rotation of the heart tube in zebrafish
- Authors
- Kidokoro, H., Saijoh, Y., Schoenwolf, G.C.
- Source
- Full text @ Commun Biol
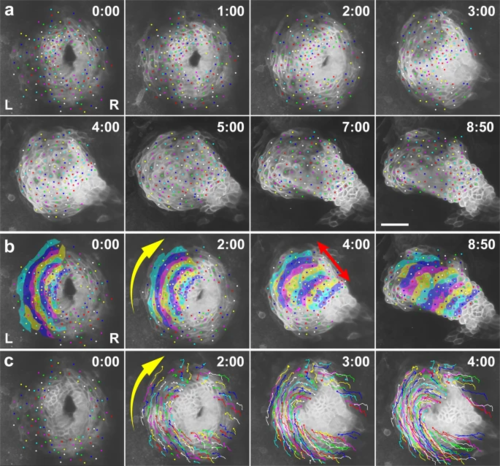
a Selected images from a confocal time-lapse recording of a Tg(myl7:EGFP-CAAX)ncv536Tg embryo starting at 20 hpf (Supplementary Movie 1). Cell membranes of myocardial cells are specifically labeled with GFP in the transgenic line. Dorsal view (anterior to the top). Relative times after the initiation of the recording (h:min) are indicated in the upper right corner. Color dots indicate tracking of individual myocardial cells. Images are representative of n ≥ 10 embryos. Scale bar = 50 µm. b Annotated duplicate images. Cells in the left primordium are colored. The group of cells converged in the circumferential direction toward the anterior seam of the left (L) and right (R) primordia (yellow arrow in b), while extending perpendicularly (red arrow in b) as the disc transformed into a tube. c Duplicated images overlaid with cell trajectories. Cell rearrangement and cell shortening occurred circumferentially toward the anterior seam of the left and right primordia (yellow arrow in c). |
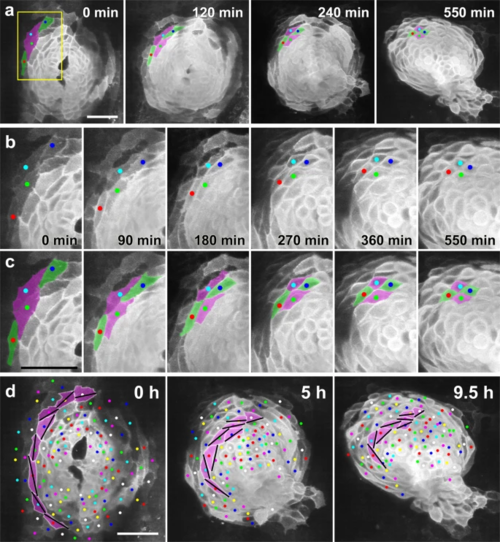
a Selected images from a confocal time-lapse recording of a Tg(myl7:EGFP-CAAX)ncv536Tg embryo starting at 19–20 hpf (Supplementary Movie 3), showing intercalating myocardial cells (green). Dorsal view (anterior to the top). Scale bar = 50 μm. b Enlargement of the region indicated by the box in a. c Colored, corresponding images to those in b. Initially the two separated cells (green) intercalated between their neighbors (magenta), coming into contact with one another and thereby separating the two neighboring cells. Note that myocardial cells were circumferentially elongated at the beginning (0 min), but progressively shortened into a round shape (550 min). Scale bar = 50 µm. d An array of cells in the left heart primordium are colored with magenta. Bars indicate the long axes of the cells. As a result of the oriented cell rearrangement, cells initially arrayed in a single row in the cardiac disc piled up to generate two or more rows. Cell intercalation was consistently observed in n ≥ 10 embryos. Scale bar = 50 µm. |
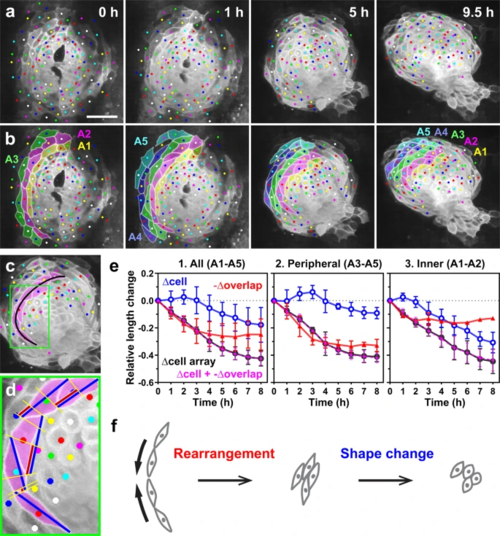
a, b For quantitative analysis, we considered cells circumferentially arrayed in a row (A1–A5, each cell array is shown in a different color in b) as a unit. a Selected images from a confocal time-lapse recording of a Tg(myl7:EGFP-CAAX)ncv536Tg embryo starting at 19–20 hpf. Dorsal view (anterior to the top). Scale bar = 50 µm. b Colored, corresponding images to those in a. Cells in the left primordium (colored cells) were analyzed. Cell arrays are numbered from the inner to the peripheral order (A1–A5). We measured the length of each cell array (black line in c), the length of constituent cells (blue lines in d) and the overlap length between neighboring cells (red lines in d) every 1 h. c A cell array is indicated by magenta. d Enlargement of the region indicated by the box in c. e Relative length changes of cell arrays (black), cells (blue), and loss of the cell lengths caused by the cell overlap (red) in five cell arrays (e1, A1–A5 indicated in b), in the peripheral cell arrays (e2, A3–A5) and in the inner cell arrays (e3, A1–A2). Magenta plots represent the sum of relative changes of cell length (blue) and the length loss by the cell overlap (red). n = 5 cell arrays, 4–8 cells per each cell array (1 embryo). Data are normalized relative to sum of cell lengths at the initial time point to eliminate the effects of each cell array size. Means ± s.d. are shown. Corresponding graphs indicating individual data points are shown in Supplementary Fig. 2. f Model for convergence of the cardiac disc based on our quantitative analysis. Circumferential convergence is initially driven by oriented cell rearrangement and subsequently by cell shortening. |

a Cells derived from the left (magenta) and right (green) primordia are color-coded. The posterior border of the left and right primordia shifted from 6 o’clock to 7–9 o’clock, suggesting that the left primordium converged more rapidly than the right one. Cells with ambiguous left-right origins are left uncolored. The original corresponding images are shown in Fig. 4a. Scale bar = 50 µm. b–d Quantification of the convergence of the left (L) and right (R) primordia. We analyzed the anterior portion of the primordia (colored regions in b) because the posterior portion of the right primordium became hidden due to their involution shortly after heart rotation started. The dashed lines in b indicate the boundary of the left and right primordia. Scale bar = 50 µm. c Plots of the relative lengths (Lt/L0) of peripheral (1) and inner (2) cell arrays in wild-type embryos. Lt is the length at time t, L0 is the length at t = 0. The left (magenta plots) peripheral cell arrays (A3 and A4 in b) converged more rapidly than the right (green plots) ones, whereas no significant difference was observed between the left and right cell arrays in the inner region (A1 and A2 in b). *p < 0.05, **p < 0.01, ***p < 0.005 (two-tailed t-test assuming unequal variances, n = 3 embryos). Means ± s.d. are shown. d Relative length changes of cell arrays (black), cells (blue), and loss of the cell lengths caused by the cell overlap (red) in the peripheral (1) and inner (2) cell arrays in wild-type embryos. n = 3 embryos. Means ± s.d. are shown. For c, d, corresponding graphs indicating individual data points are shown in Supplementary Fig. 4. |
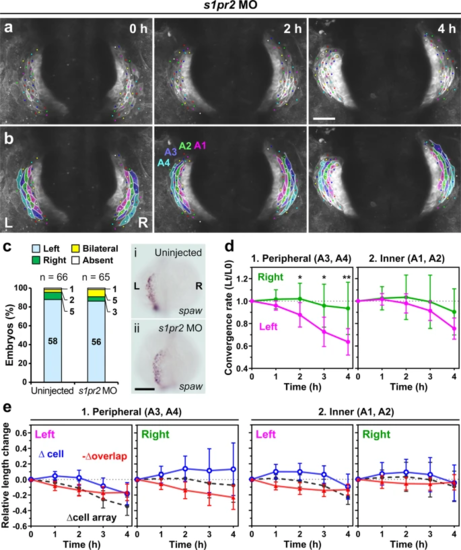
a, b Embryos with cardia bifida were created by injecting s1pr2 MO, which inhibits endoderm convergence and subsequent heart primordia fusion. Asymmetric convergence still occurred in the two hearts. a Selected images from a confocal time-lapse recording of a s1pr2 MO-injected Tg(myl7:EGFP-CAAX)ncv536Tg embryo starting at 19–20 hpf (Supplementary Movie 6). Dorsal view (anterior to the top). Scale bar = 50 µm. b Colored, corresponding images to those in a. Four cell arrays are labeled with different colors (A1–A4). c spaw mRNA expression in uninjected (i) and s1pr2 MO-injected (ii) embryos was assessed by in situ hybridization. The bar graph shows percentage of control (uninjected siblings, n = 66) and s1pr2 MO-injected embryos (n = 65) with left-sided, right-sided, bilateral, or absence of spaw expression in the lateral plate mesoderm (LPM). Morpholino injection did not perturb the normal left-sided spaw expression in the LPM. Scale bar = 200 µm. d Plots of the relative lengths (Lt/L0) of peripheral (1) and inner (2) cell arrays in s1pr2 MO-injected embryos (cardia bifida). The left cell arrays in the peripheral region (A3 and A4) converged more rapidly than the right ones, whereas no significant difference was observed between the left and right cell arrays in the inner region (A1 and A2), similar to that as in normal embryos shown in Fig. 5. *p < 0.05, **p < 0.01, ***p < 0.005 (two-tailed t-test assuming unequal variances, n = 4 embryos). Means ± s.d. are shown. e Relative length changes of cell arrays (black), cells (blue), and loss of the cell lengths caused by the cell overlap (red) in the peripheral (1) and inner (2) cell arrays in s1pr2 MO-injected embryos. n = 4 embryos. Means ± s.d. are shown. For d, e, corresponding graphs indicating individual data points are shown in Supplementary Fig. 5. |
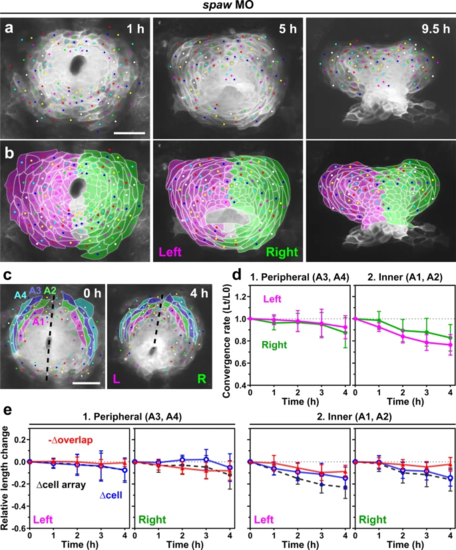
a, b Spaw knockdown resulted in failure of the clockwise shift of the posterior border between the left and right heart primordia. a Selected images from a confocal time-lapse recording of a spaw MO-injected Tg(myl7:EGFP-CAAX)ncv536Tg embryo starting at 19–20 hpf (Supplementary Movie 7). Dorsal view (anterior to the top). Scale bar = 50 µm. b Colored, corresponding images to those in a. Cells derived from the left (magenta) and right (green) primordia are color-coded. Cells with ambiguous left-right origins are left uncolored. c–e Quantification of the convergence of the left (L) and right (R) primordia. The anterior portion of the primordia (colored regions in c) were analyzed. Scale bar in c = 50 µm. d Plots of the relative lengths (Lt/L0) of peripheral (1) and inner (2) cell arrays in spaw MO-injected embryos. No significant difference was observed between the left (magenta plots) and right (green plots) cell arrays in both the peripheral and inner regions (two-tailed t-test assuming unequal variances, n = 3 embryos), unlike uninjected embryos (Fig. 5). Means ± s.d. are shown. e Relative length changes of cell arrays (black), cells (blue), and loss of the cell lengths caused by the cell overlap (red) in the peripheral (1) and inner (2) cell arrays in spaw MO-injected embryos. n = 3 embryos. Means ± s.d. are shown. For d, e, corresponding graphs indicating individual data points are shown in Supplementary Fig. 6. |
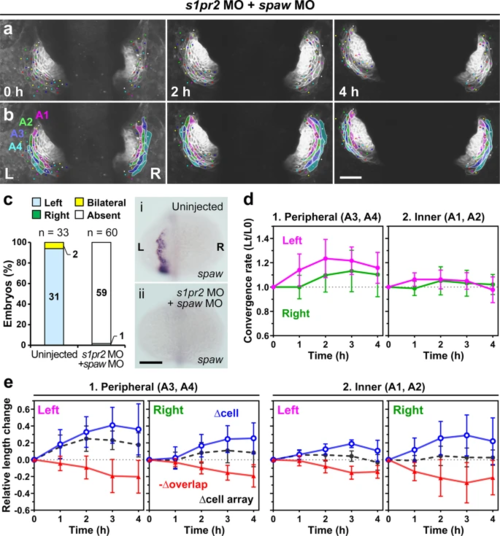
a, b Loss of Nodal signaling abolished asymmetric convergence of the left (L) and right (R) primordia in cardia bifida. a Selected images from a confocal time-lapse recording of a Tg(myl7:EGFP-CAAX)ncv536Tg embryo co-injected with spaw MO and s1pr2 MO starting at 19–20 hpf (Supplementary Movie 8). Ventral view (anterior to the top). The images were horizontally flipped to be presented in a consistent left-right orientation with other images. b Colored, corresponding images to those in a. Four cell arrays are labeled with different colors (A1–A4). Scale bar = 50 µm. c spaw mRNA expression in uninjected (i) and MO-injected (ii) embryos was assessed by in situ hybridization. The bar graph shows percentage of control (uninjected siblings, n = 33), and spaw MO and s1pr2 MO co-injected embryos (n = 60) with left-sided, right-sided, bilateral, or absence of spaw expression in the lateral plate mesoderm (LPM). Morpholino injection abolished spaw expression in the LPM. Scale bar = 200 µm. d Plots of the relative lengths (Lt/L0) of peripheral (1) and inner (2) cell arrays in spaw and s1pr2 double morphants. In embryos injected with both spaw MO and s1pr2 MO, left myocardial cell arrays did not exhibit the more rapid convergence unlike morphants injected with only s1pr2 MO shown in Fig. 6. No significant left-right difference was found in both the peripheral and inner cell arrays (two-tailed t-test assuming unequal variances, n = 3 embryos). Means ± s.d. are shown. e Relative length changes of cell arrays (black), cells (blue), and loss of the cell lengths caused by the cell overlap (red) in the peripheral (1) and inner (2) cell arrays in spaw and s1pr2 double morphants. Cell length in the morphants was markedly increased in both left and right cells. n = 3 embryos. In one out of these three embryos, only A2–A4 cell arrays were analyzed because accurate measuring was difficult in A1 cell arrays of this embryo. Means ± s.d. are shown. For d, e, corresponding graphs indicating individual data points are shown in Supplementary Fig. 10. |