
Fig. 8
- ID
- ZDB-FIG-220923-39
- Publication
- Kidokoro et al., 2022 - Nodal signaling regulates asymmetric cellular behaviors, driving clockwise rotation of the heart tube in zebrafish
- Other Figures
- All Figure Page
- Back to All Figure Page
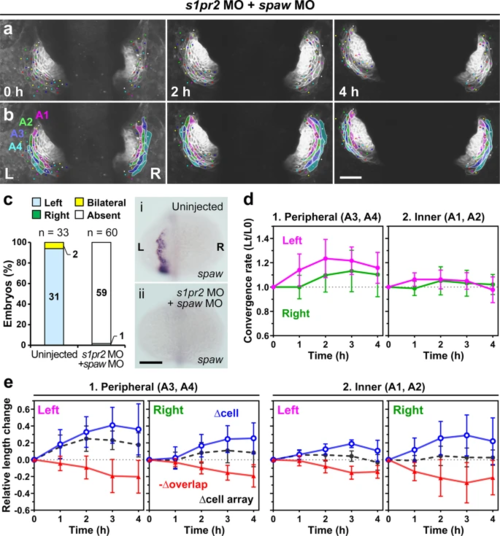
a, b Loss of Nodal signaling abolished asymmetric convergence of the left (L) and right (R) primordia in cardia bifida. a Selected images from a confocal time-lapse recording of a Tg(myl7:EGFP-CAAX)ncv536Tg embryo co-injected with spaw MO and s1pr2 MO starting at 19–20 hpf (Supplementary Movie 8). Ventral view (anterior to the top). The images were horizontally flipped to be presented in a consistent left-right orientation with other images. b Colored, corresponding images to those in a. Four cell arrays are labeled with different colors (A1–A4). Scale bar = 50 µm. c spaw mRNA expression in uninjected (i) and MO-injected (ii) embryos was assessed by in situ hybridization. The bar graph shows percentage of control (uninjected siblings, n = 33), and spaw MO and s1pr2 MO co-injected embryos (n = 60) with left-sided, right-sided, bilateral, or absence of spaw expression in the lateral plate mesoderm (LPM). Morpholino injection abolished spaw expression in the LPM. Scale bar = 200 µm. d Plots of the relative lengths (Lt/L0) of peripheral (1) and inner (2) cell arrays in spaw and s1pr2 double morphants. In embryos injected with both spaw MO and s1pr2 MO, left myocardial cell arrays did not exhibit the more rapid convergence unlike morphants injected with only s1pr2 MO shown in Fig. 6. No significant left-right difference was found in both the peripheral and inner cell arrays (two-tailed t-test assuming unequal variances, n = 3 embryos). Means ± s.d. are shown. e Relative length changes of cell arrays (black), cells (blue), and loss of the cell lengths caused by the cell overlap (red) in the peripheral (1) and inner (2) cell arrays in spaw and s1pr2 double morphants. Cell length in the morphants was markedly increased in both left and right cells. n = 3 embryos. In one out of these three embryos, only A2–A4 cell arrays were analyzed because accurate measuring was difficult in A1 cell arrays of this embryo. Means ± s.d. are shown. For d, e, corresponding graphs indicating individual data points are shown in Supplementary Fig. 10. |