
|
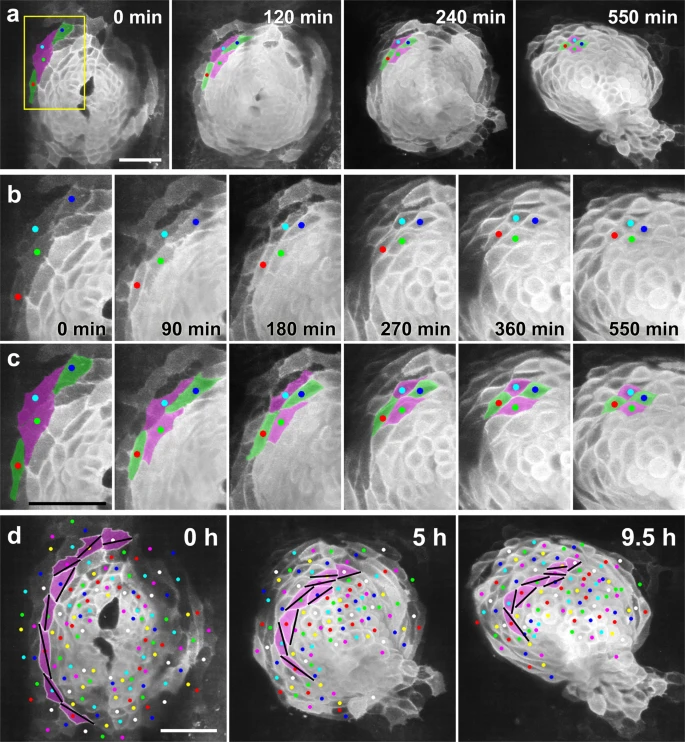
Fig. 3
a Selected images from a confocal time-lapse recording of a Tg(myl7:EGFP-CAAX)ncv536Tg embryo starting at 19–20 hpf (Supplementary Movie 3), showing intercalating myocardial cells (green). Dorsal view (anterior to the top). Scale bar = 50 μm. b Enlargement of the region indicated by the box in a. c Colored, corresponding images to those in b. Initially the two separated cells (green) intercalated between their neighbors (magenta), coming into contact with one another and thereby separating the two neighboring cells. Note that myocardial cells were circumferentially elongated at the beginning (0 min), but progressively shortened into a round shape (550 min). Scale bar = 50 µm. d An array of cells in the left heart primordium are colored with magenta. Bars indicate the long axes of the cells. As a result of the oriented cell rearrangement, cells initially arrayed in a single row in the cardiac disc piled up to generate two or more rows. Cell intercalation was consistently observed in n ≥ 10 embryos. Scale bar = 50 µm.