
|
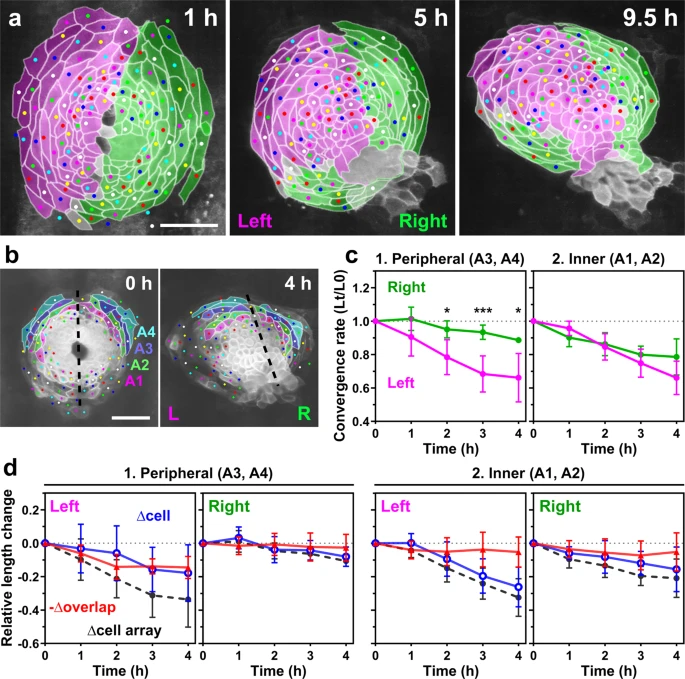
Fig. 5
a Cells derived from the left (magenta) and right (green) primordia are color-coded. The posterior border of the left and right primordia shifted from 6 o’clock to 7–9 o’clock, suggesting that the left primordium converged more rapidly than the right one. Cells with ambiguous left-right origins are left uncolored. The original corresponding images are shown in Fig. 4a. Scale bar = 50 µm. b–d Quantification of the convergence of the left (L) and right (R) primordia. We analyzed the anterior portion of the primordia (colored regions in b) because the posterior portion of the right primordium became hidden due to their involution shortly after heart rotation started. The dashed lines in b indicate the boundary of the left and right primordia. Scale bar = 50 µm. c Plots of the relative lengths (Lt/L0) of peripheral (1) and inner (2) cell arrays in wild-type embryos. Lt is the length at time t, L0 is the length at t = 0. The left (magenta plots) peripheral cell arrays (A3 and A4 in b) converged more rapidly than the right (green plots) ones, whereas no significant difference was observed between the left and right cell arrays in the inner region (A1 and A2 in b). *p < 0.05, **p < 0.01, ***p < 0.005 (two-tailed t-test assuming unequal variances, n = 3 embryos). Means ± s.d. are shown. d Relative length changes of cell arrays (black), cells (blue), and loss of the cell lengths caused by the cell overlap (red) in the peripheral (1) and inner (2) cell arrays in wild-type embryos. n = 3 embryos. Means ± s.d. are shown. For c, d, corresponding graphs indicating individual data points are shown in Supplementary Fig. 4.