
- Title
-
The Inhibitory Effect of Polyphenon 60 from Green Tea on Melanin and Tyrosinase in Zebrafish and A375 Human Melanoma Cells
- Authors
- Kazi, M.A., Sahito, R., Abbas, Q., Ullah, S., Majid, A., Phull, A.R., Rahman, M.M., Kim, S.J.
- Source
- Full text @ Evid. Based Complement. Alternat. Med.
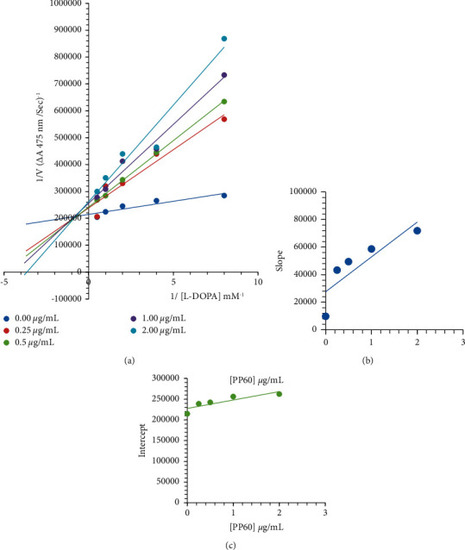
A plot of the Lineweaver‒Burk plot for tyrosinase inhibition of PP60. (a) Accordingly, the concentrations of PP60 were 0, 0.25, 0.5, 1.0, and 2.0 |
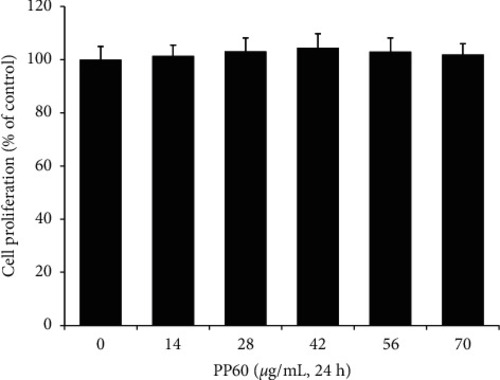
The cell viability of PP60 was evaluated by treating A375 melanoma cells for 24 hours with various concentrations and examining cytotoxicity using the viability assay kit. All of the results and values are represented as the average of triplicate experiments with standard deviation. |

The protein expression of the enzyme tyrosinase was analyzed in comparison with GAPDH on the A375 melanoma cell line. The cells (a, b) were targeted to different L-DOPA concentrations with and without (20, 40, and 60 g/mL) of PP60 for 24 hours. From the western blot analysis, the appearance of tyrosinase was clarified with the help of GAPDH as a loading control. The differences were considered significant at the level of # |
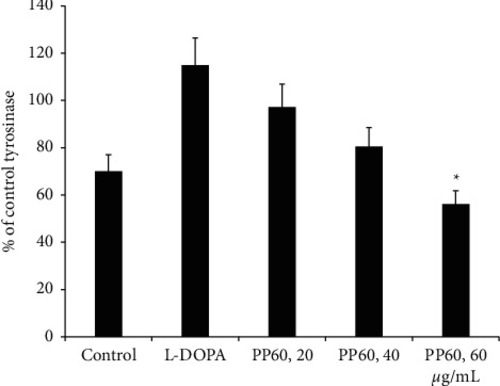
The PP60 was evaluated against the cellular tyrosinase. The cells of A375 of melanoma were evaluated with ranges of concentration from 20, 40, and 60 |
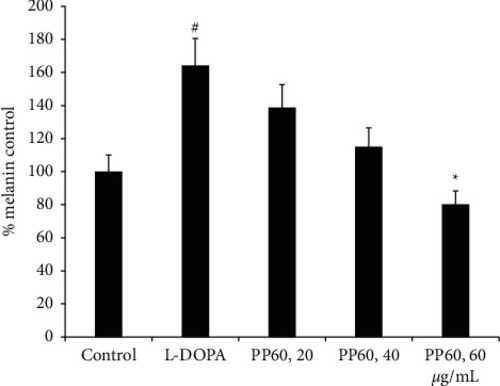
PP60 effect against melanin assay was studied. PP60 was added in varying concentrations to A375 melanoma cells, 20, 40, and 60 |
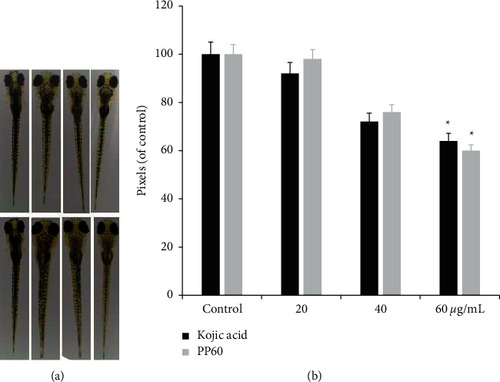
The depigmentation effect of PP60 on zebrafish. Positive control, kojic acid, and embryos treated with sample PP60 at 20, 40, and 60 |
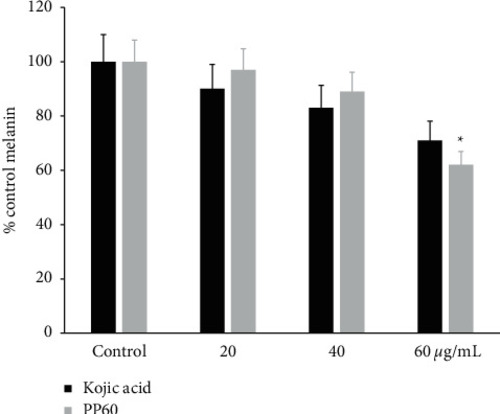
The PP60 and its effect on melanin contents were measured using embryos of the zebrafish. The positive control kojic acid together with the embryos of the zebrafish was evaluated with 20, 40, and 60 |