
Image
|
Figure Caption
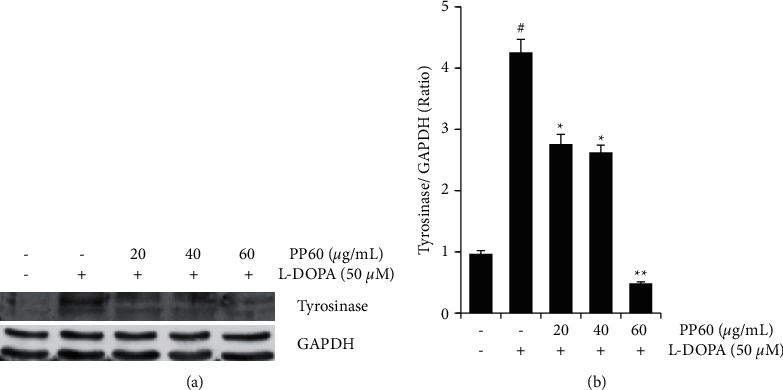
Figure 3
The protein expression of the enzyme tyrosinase was analyzed in comparison with GAPDH on the A375 melanoma cell line. The cells (a, b) were targeted to different L-DOPA concentrations with and without (20, 40, and 60 g/mL) of PP60 for 24 hours. From the western blot analysis, the appearance of tyrosinase was clarified with the help of GAPDH as a loading control. The differences were considered significant at the level of #
Acknowledgments
This image is the copyrighted work of the attributed author or publisher, and
ZFIN has permission only to display this image to its users.
Additional permissions should be obtained from the applicable author or publisher of the image.
Full text @ Evid. Based Complement. Alternat. Med.