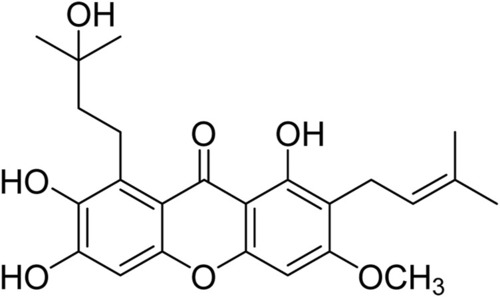
Chemical structure of cratoxylumxanthone C.

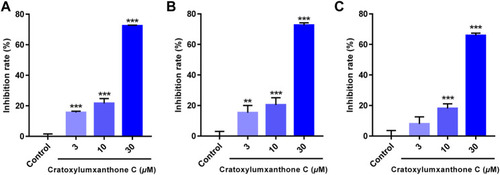
Cratoxylumxanthone C inhibited the proliferation and viability of three human cancer cell lines. A549 (A), HepG2 (B) and MCF7 (C) cells were treated with cratoxylumxanthone C (3, 10, and 30 μM) for 48 h. Cell viability was detected by MTT assay. The results are presented as means ± SD. **p < 0.01 and ***p < 0.001 versus control group.

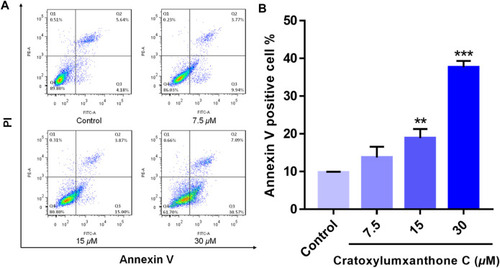
Cratoxylumxanthone C induced apoptosis in A549 cells. A549 cells were treated with different concentrations (7.5, 15, and 30 μM) of cratoxylumxanthone C for 48 h. Cells were stained with Annexin V and propidium iodide (PI), and subsequently analyzed by flow cytometry. (A) Flow cytometric analysis of A549 cells after treated with different concentrations of cratoxylumxanthone C. (B) Histogram of the proportions of apoptotic cells at 48 h with the treatment of cratoxylumxanthone C. The results are expressed as means ± SD. **p < 0.01 and ***p < 0.001 versus control group.

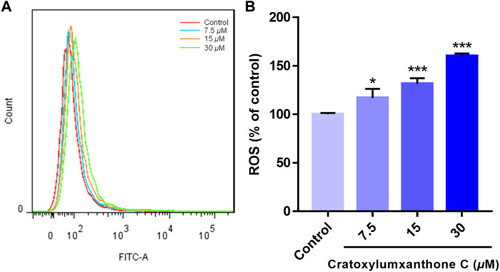
Cratoxylumxanthone C increased ROS production in A549 cells. A549 cells were treated with different concentrations (7.5, 15, and 30 μM) of cratoxylumxanthone C for 48 h. Cells were stained with DCFH-DA, and analyzed by flow cytometer. (A) Flow cytometric analysis of A549 cells after treated with different concentrations of cratoxylumxanthone C. (B) Histogram of relative ROS level compared with control group. The results are expressed as means ± SD. *p < 0.05 and ***p < 0.001 versus control group.

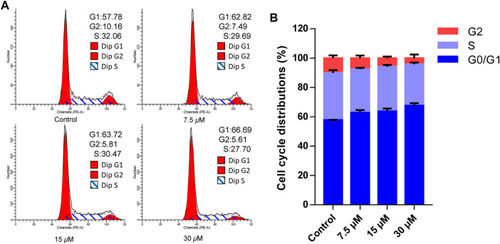
Cratoxylumxanthone C arrested G0/G1 phase in A549 cells. A549 cells were treated with different concentrations (7.5, 15, and 30 μM) of cratoxylumxanthone C for 48 h. Then the cells were stained with propidium iodide (PI), and the cell cycle distribution was analyzed using flow cytometry. (A) Flow cytometric analysis of A549 cells after treated with different concentrations of cratoxylumxanthone C. (B) Histogram of cell cycle phases distribution.

Cratoxylumxanthone C regulated STAT3 signaling pathway and apoptosis-related proteins. (A) Western blotting analysis was conducted to evaluate the effects of cratoxylumxanthone C on the expression of STAT3, p-STAT3, Mcl-1, cyclin D1, Bcl-2, caspase-3, and caspase-9. (B) Histogram of the protein relative expression level compared with control group. The results are expressed as means ± SD. *p < 0.05, **p < 0.01 and ***p < 0.001 versus control group.

Cratoxylumxanthone C inhibited migration in A549 cells and regulated FAK/MMP2 signaling pathway. (A) A549 cells were photographed at 0 and 48 h. (B) Data of migration rates (%) were shown in the histogram. (C) Western blotting analysis was used to evaluate the effects of cratoxylumxanthone C on the expression of FAK, p-FAK, MMP2. (D) Histogram of the protein relative expression level compared with control group. The results are expressed as means ± SD. *p < 0.05 and ***p < 0.001 versus the control group.

Cratoxylumxanthone C inhibited proliferation and migration of A549 cells in zebrafish xenografts. CM-DiI stained A549 cells were microinjected into 2 dpf zebrafish embryos. After 4 h, tumor-bearing embryos were treated with cratoxylumxanthone C (2.5, 5, and 10 μM) and the positive control, etoposide (10 μM) for 48 h (n = 15/group). (A) Intensity and distribution of the red fluorescence were imaged under a confocal microscope of disseminated foci in zebrafish. (B) The proliferation was quantified by ImageJ software. (C) The metastasis of A549 cells were quantified using ImageJ software. All results are expressed as the mean ± SD. **p < 0.01 and ***p < 0.001 versus the control group.

The embryos from transgenic zebrafish Tg(fli1: EGFP) were treated with cratoxylumxanthone C (5, 10, and 20 μM) and the positive control, sunitinib malate (2 μM) for 48 h. (A) The development of intersegmental vessels (ISVs) was observed under a confocal microscope. (B) The average length of ISVs of zebrafish after treating with cratoxylumxanthone C (5, 10, and 20 μM) and sunitinib malate (n = 15/group). All results are expressed as the mean ± SD. **p < 0.01 and ***p < 0.001 versus the control group.

Acknowledgments
This image is the copyrighted work of the attributed author or publisher, and ZFIN has permission only to display this image to its users. Additional permissions should be obtained from the applicable author or publisher of the image. Full text @ Front Pharmacol