IMAGE

FIGURE 7

ID
ZDB-IMAGE-220827-7
Source
Figures for Li et al., 2022
Image
Figure Caption

FIGURE 7

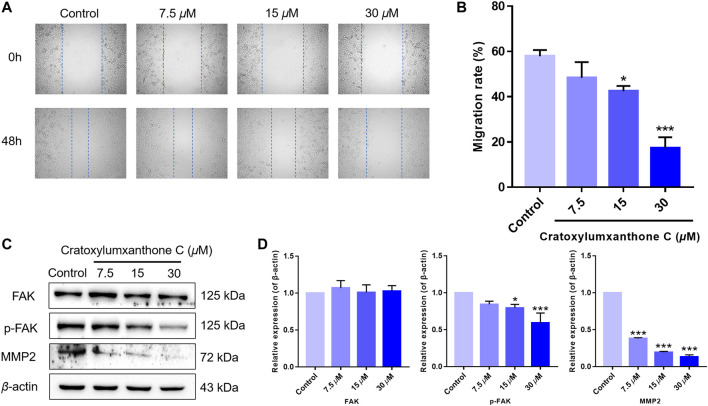
Cratoxylumxanthone C inhibited migration in A549 cells and regulated FAK/MMP2 signaling pathway. (A) A549 cells were photographed at 0 and 48 h. (B) Data of migration rates (%) were shown in the histogram. (C) Western blotting analysis was used to evaluate the effects of cratoxylumxanthone C on the expression of FAK, p-FAK, MMP2. (D) Histogram of the protein relative expression level compared with control group. The results are expressed as means ± SD. *p < 0.05 and ***p < 0.001 versus the control group.

Acknowledgments
This image is the copyrighted work of the attributed author or publisher, and ZFIN has permission only to display this image to its users. Additional permissions should be obtained from the applicable author or publisher of the image. Full text @ Front Pharmacol