FIGURE SUMMARY
Title

Acetaminophen Disrupts the Development of Pharyngeal Arch-Derived Cartilage and Muscle in Zebrafish

Authors
Glasco, D.M., Wang, Z., Kang, S., Funkhouser, A.T.
Source
Full text @ J Dev Biol

ZFIN is incorporating published figure images and captions as part of an ongoing project. Figures from some publications have not yet been curated, or are not available for display because of copyright restrictions.

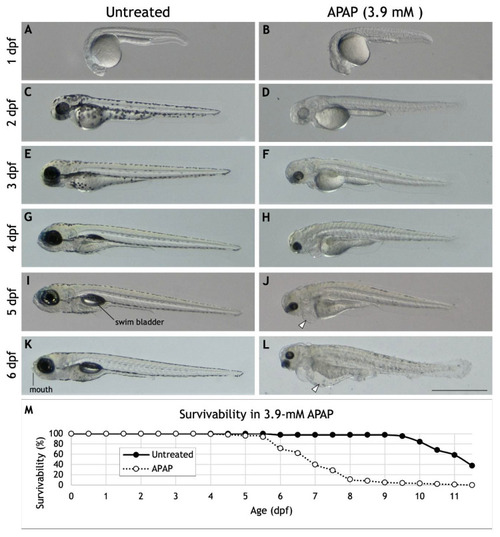
Morphology and survivability of APAP-treated larvae. (AL) Lateral views of a single, representative larva either untreated (A,C,E,G,I,K) or continuously treated with 3.9-mM APAP from 2 hpf (B,D,F,H,J,L). Previously reported abnormalities visible here include reduced pigmentation, deformed tail and fin, failure to inflate swim bladder (compare (I) and (J)), peritoneal edema (arrowhead in (J)), and pericardial edema (arrowhead in (L)). Note the absence of a visible jaw or mouth in the APAP-treated larva (compare (K) and (L)). Many other larvae (not shown) also exhibit reduced body length and severe spinal curvature as reported elsewhere. Scale bar (in (L)) for (AL), 1 mm. (M) Survivability of untreated larvae (n = 88) and larvae continuously treated with 3.9-mM APAP from 2 hpf (n = 98). The longest-lived treated larva survived until 11.5 dpf.

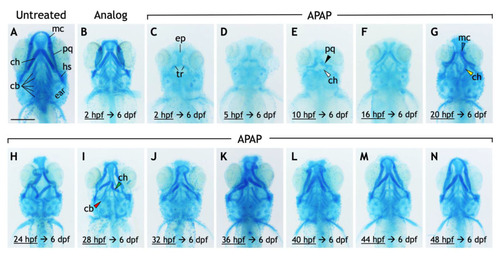
Exposure to acetaminophen, but not a non-hepatoxic analog, disrupts the development and morphology of craniofacial cartilages. (AN) Ventral views of 6-dpf larvae stained with alcian blue. Compared to untreated larvae (A), those treated continuously with 3-acetamidophenol (3.9 mM), a non-hepatotoxic acetaminophen analog (B), have a reduced body size but with all craniofacial cartilages intact. (CN) APAP treatment (3.9 mM) was initiated at the timepoints indicated then continuously through 6 dpf. The effects on the cartilages of the viscerocranium (labeled in (A)), in both their presence and morphology, are generally less severe as the initiation of treatment is delayed (CN). In a larva treated with APAP from 2 hpf (C), all cartilages of the viscerocranium are missing, making visible cartilages of the neurocranium, most prominently the ethmoid plate (ep) and the bilateral trabeculae (tr). These cartilages were clearly visible in all larvae in all treatment groups. Incrementally delaying treatment results in the restoration of cartilages derived from the first and second pharyngeal arches (e.g., Meckel’s cartilage) earliest, followed by cartilages derived from the third through seventh pharyngeal arches (ceratobranchial cartilages). With treatment delayed to 10 hpf, the palatoquadrate (pq) and ventral ceratohyal (ch) cartilages are more frequently present (black and white arrowheads in E, respectively). When treatment is delayed to at least 20 hpf, the ventral ceratohyal cartilages tend to be oriented posteriorly rather than anteriorly (compare yellow arrowhead in (G) with morphology in (A)), and Meckel’s cartilage (mc) becomes more frequent (blue arrowhead in (G)) though misshapen. The ventral ceratohyal cartilages also begin to be oriented anteriorly (green arrowhead in (I)). Treatment at 28 hpf restores a reduced number of ceratobranchial cartilages in most larvae (red arrowhead in (I)), though they can appear as early as with a 24 hpf treatment. One representative larva is shown from each treatment group, though the effects vary within each treatment group. Scale bar (in (A)) for (AN), 250 µm.

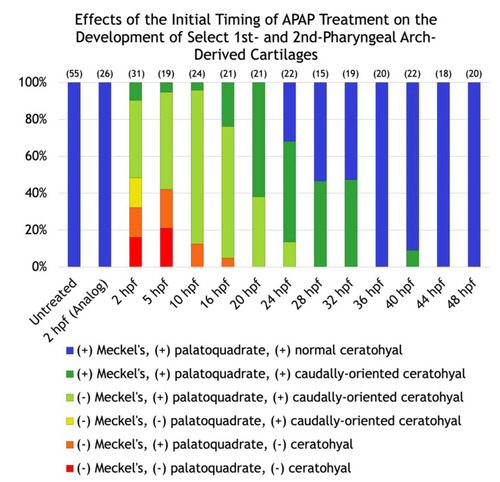
Effects of the initial timing of APAP treatment on the development of select first and second pharyngeal arch-derived cartilages. A quantification of the defects shown in Figure 2. The number of alcian blue-stained larvae analyzed for each group are in parentheses at the top of each column.

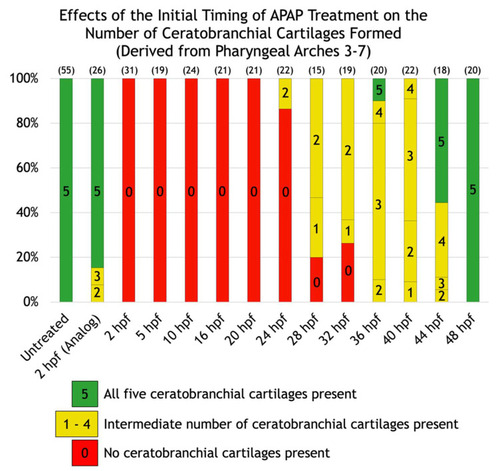
Effects of the initial timing of APAP treatment on the number of ceratobranchial cartilages formed (derived from pharyngeal arches three through seven). A quantification of the defects shown in Figure 2. The number of ceratobranchial cartilages formed are indicated within each bar. Green bars indicate all five ceratobranchial cartilages are present, yellow bars indicate an intermediate number, and red bars indicate none are present. The number of alcian blue-stained larvae analyzed for each group are in parentheses at the top of each column.

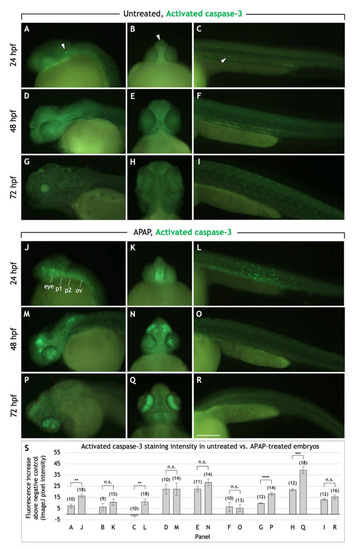
APAP treatment increases apoptosis in the head and pharyngeal arches before and during cartilage differentiation. Lateral and rostroventral views of the head and trunk regions in 24, 48, and 72 hpf embryos processed for anti-activated caspase-3 immunohistochemistry to detect apoptotic cells. In untreated embryos, apoptotic cells are sparsely distributed in the head and trunk (white arrowheads in (AC) as examples). In APAP-treated embryos at 24 hpf (JL), apoptosis is substantially increased between the eyes (K) and along the length of the head (J), in the regions where the mandibular and hyoid arches (1st and 2nd pharyngeal arches) are forming. Apoptotic cells are also increased throughout the trunk (L), but by 48 and 72 hpf, are similar to control levels (O,R). At 48 hpf, large clusters of apoptotic cells are located in the dorsal head region and throughout the eye (M,N). At 72 hpf, apoptotic cells are concentrated in the iris, with significant numbers also between the eyes and at the base of the head. Abbreviations: First pharyngeal arch, b1; second pharyngeal arch, b2; otic vesicle, ov. Scale bar (in (R)) for (AR), 200 µm. (S): Quantification of staining intensity across samples represented in panels A-R. Lateral views of the head (A,D,G,J,M,P) were analyzed by measuring pixel intensity within the head region from the rostral-most portion through the otic vesicle. For ventral views of the head (B,E,H,K,N,Q), pixel intensity was measured within the entire head anterior to the yolk. For lateral views of the trunk (C,F,I,L,O,R), pixel intensity was measured within the trunk region dorsal to the yolk extension. For all images, negative control values were subtracted from actual values in order to report the overall fluorescence increase. The total number of embryos tested are in parentheses. ** = t-test at p < 0.01. *** = t-test at p < 0.001. **** = t-test at p < 0.0001. n.s. = not significant (p > 0.05). Error bars indicate the standard error of the mean.

Neural crest cell markers sox9a and sox10 are expressed in trunk and cranial neural crest cells in APAP-treated embryos. (AK) Lateral views (A,B,G,H) or ventral views (CF,IK) of embryos processed for sox9a (AF) or sox10 (GK) immunohistochemistry. sox9a-positive trunk NC cells can be seen migrating ventrally in both untreated (A) and APAP-treated (B) embryos at 32 hpf (white arrowheads). In the head at 48 hpf (C) and 72 hpf (D), sox9a labels NC-derived prechondrogenic cells. In APAP-treated embryos (E,F), sox9a expression is reduced due to missing viscerocranium/pharyngeal arch-derived cartilage types. At 32 hpf, sox10-positive trunk NC cells migrate ventrally in streams in untreated embryos ((G), white arrowheads). In APAP-treated embryos (H), sox10-positive cells are reduced in number but follow similar migration paths (white arrowheads). In the head at 48 hpf (I), sox10 is expressed along the midline of the neurocranium, verified by comparison with negative control embryos in which the same secondary antibody (but no primary antibody) was applied (J). In APAP-treated embryos, sox10 expression is similar but more robust, with enhanced expression along the yolk sac (white arrowhead). (L) An overview of a basic gene regulatory network in NC-derived cartilage precursor cells in chick (from Suzuki 2006). Red lines indicate interactions that have not been established in zebrafish. In early NC cells, Sox9 induces Sox10 expression, which in turn downregulates Sox9. In cartilage precursors, Sox10 expression is downregulated causing the recovery of Sox9 expression. Together, both Sox9 and Sox10 positively regulate Col2a1 expression, a marker for differentiating chondrocytes. Abbreviations: ceratobranchial cartilages, cb; ventral ceratohyal, ch; ethmoid plate, ep; dorsal hyosymplectic, dh; Meckel’s cartilage, mc; palatoquadrate, pq; trabecular, tr. Scale bar (in (K)) for (AK), 200 µm.

Most APAP-treated embryos express collagen type II, a marker for differentiated cartilage, in the craniofacial region. (AC) Ventral views of 72-hpf embryos processed for col2a1 (collagen type II) IHC. Untreated embryos (A) express col2a1 in all craniofacial cartilages. In most APAP-treated embryos (B), col2a1 expression is equally robust but reflects the absence of numerous cartilage types. Diffuse col2a1 expression is consistently observed around the developing ears and at the base of the head. In other APAP-treated embryos (C), col2a1 expression is completely absent in the anterior head region. The numbers of col2a1-labeled, APAP-treated embryos are labeled in parentheses. Abbreviations: ceratobranchial cartilages, cb; ventral ceratohyal, ch; ethmoid plate, ep; dorsal hyosymplectic, dh; Meckel’s cartilage, mc; palatoquadrate, pq. Scale bar (in (A)) for (AC), 200 µm.

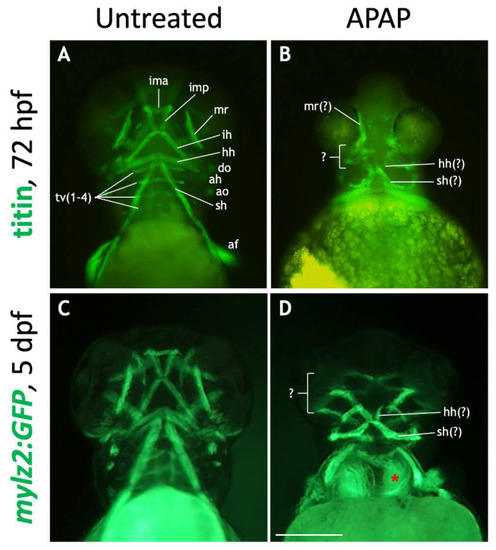
Many craniofacial muscles are absent or disorganized in APAP-treated larvae. (A,B): Ventral views of 72-hpf embryos processed for titin immunohistochemistry to label muscles. In an untreated embryo (A), ventral muscle types are in focus and labeled according to type. In an APAP-treated embryo (B), developing muscles are present but disorganized. (C,D): Ventral views of live-imaged, 5-dpf mylz2:GFP larvae which express GFP in skeletal muscles. Compared to an untreated larva (C), an APAP-treated larva (D) has a reduced number of misarranged craniofacial muscles. Due to missing musculoskeletal elements from branchial arches three though seven, the underlying anterior somites are visible (red asterisk in (D)). The defects in both titin-stained and mylz2:GFP larvae are variable, but the most common arrangements are shown here. Abbreviations (after Schilling and Kimmel 1997): aboral fin, af; adductor hyoideus, ah; adductor opercula, ao; dilator opercula, do; hyohyoideus, hh; interhyoideus, ih; intermandibularis anterior, ima; intermandibularis posterior, imp; medial rectus, mr; sternohyoideus, sh; transversus ventralis, tv. Scale bar (in (D)) for (AD), 200 µm.

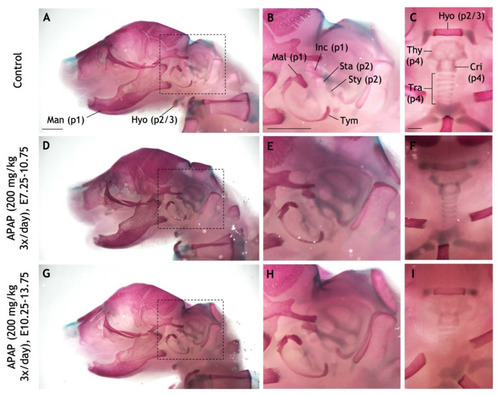
Repeated administration of high APAP dosage to pregnant mice does not recapitulate craniofacial defects. (AI) Pregnant dams were administered via oral gavage three times daily: Saline between E10.25–13.75 (AC), 200 mg/kg APAP between E7.25–10.75 (DF), 200 mg/kg APAP between E10.25–13.75 (GI). The resulting pups were collected at P0 and stained with alcian blue (cartilage) and alizarin red (bone). (AC) A control pup with pertinent bones and cartilages labeled. Pharyngeal arch-derived structures are indicated with parentheses (e.g., “p1” = derived from the first pharyngeal arch). (DF) In a pup whose mother was treated with APAP between E7.25–10.75, all labeled structures develop normally. (GI) No defects seen in a pup whose mother was treated with APAP between E10.25–13.75. Dashed boxes in (A,D,G) are the fields of view for panels (B,E,H), respectively. Abbreviations: cricoid cartilage, Cri; hyoid, Hyo; incus, Inc; malleus, Mal; mandible, Man; stapes, Sta; styoid process of the temporal bone, Sty; thyroid cartilage, Thy; tracheal cartilages, Tra; tympanic, Tym. Scale bars in (AC), 1 mm.

Acknowledgments
This image is the copyrighted work of the attributed author or publisher, and ZFIN has permission only to display this image to its users. Additional permissions should be obtained from the applicable author or publisher of the image. Full text @ J Dev Biol