
Image
|
Figure Caption
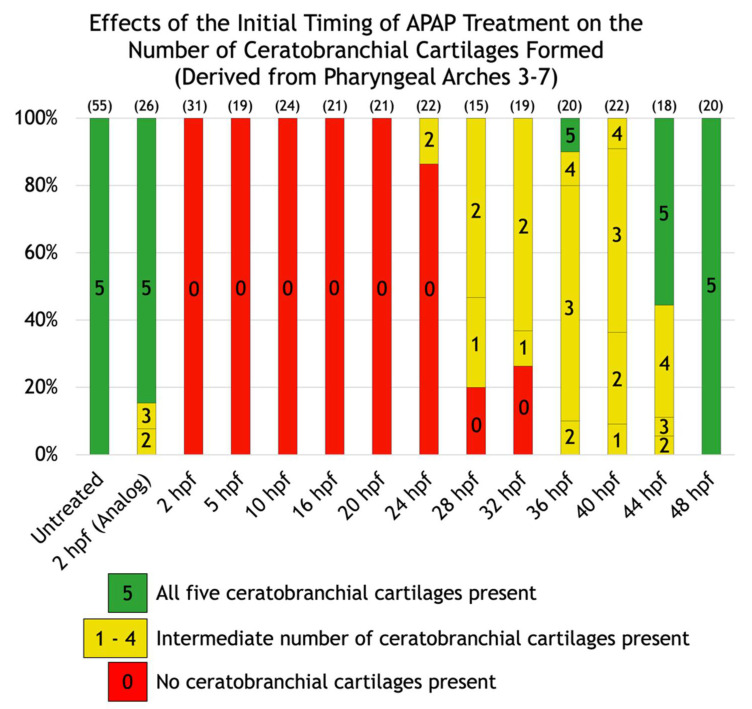
Figure 4
Effects of the initial timing of APAP treatment on the number of ceratobranchial cartilages formed (derived from pharyngeal arches three through seven). A quantification of the defects shown in
Acknowledgments
This image is the copyrighted work of the attributed author or publisher, and
ZFIN has permission only to display this image to its users.
Additional permissions should be obtained from the applicable author or publisher of the image.
Full text @ J Dev Biol