
- Title
-
Two HCN4 Channels Play Functional Roles in the Zebrafish Heart
- Authors
- Liu, J., Kasuya, G., Zempo, B., Nakajo, K.
- Source
- Full text @ Front. Physiol.

Zebrafish HCN4 channels are hyperpolarization-activated ion channels. (A) Representative currents of the human HCN4 channel HsHCN4 (black) and zebrafish HCN4 channels DrHCN4 (blue) and DrHCN4L (red). The holding potential was stepped from −30 mV to −130 mV in 10-mV decrements and held for 5 s at each potential. The inset shows the stimulation protocol. (B) Time constants obtained by fitting the activating currents of HsHCN4 (black), DrHCN4 (red) and DrHCN4L (blue) at −130 mV. (C) Activation curves (G–V curves) of human and zebrafish HCN4 channels (n = 5 for each). |

The cytoplasmic C-terminal region of DrHCN4 and DrHCN4L determines the voltage dependence. (A) Molecular designs and representative currents of chimeric channels: DrHCN4-4L (left, purple) and DrHCN4L (right, orange). (B) Activation time constants (τ act) at −130 mV of DrHCN4 (blue), DrHCN4L (red), DrHCN4-4L (purple) and DrHCN4L-4 (orange). The currents were fitted with a single exponential. (C) Activation curves of the zebrafish chimeric HCN4 channels (n = 5). The Boltzmann function was used to fit the curves. Blue and red dashed curves are the activation curves of DrHCN4 and DrHCN4L from Figure 1C. (D) Representative current traces of the EA mutants, DrHCN4 EA and DrHCN4L EA. (E) Activation curves of the EA mutant channels (n = 5). The Boltzmann function was used to fit the curves. Blue and red dashed curves are the activation curves of DrHCN4 and DrHCN4L from Figure 1C. |

DrHCN4 and DrHCN4L can form a heterotetrametric channel. (A) Representative current traces of a mixture of DrHCN4 and DrHCN4L mRNA. The mixed mRNA concentrations were 1:1 (green) and 3:1 (light green). Membrane potential was varied from −30 mV to −130 mV in 10-mV decrements and held for 5 s at each potential. The inset shows the stimulation protocol. (B) Activation curves of the mixed channels of DrHCN4 and DrHCN4L. The mixed mRNA concentrations were 1:1 (green) and 3:1 (light green). Blue and red curves are the activation curves of DrHCN4 and DrHCN4L, respectively. The Boltzmann function fits the activation curves (n = 5). All data are from the same batch of oocytes. Therefore, the data sets of DrHCN4 and DrHCN4L are different from the datasets used in Figures 1, ,2.2. (C) Representative current traces of a dominant-negative mutant with or without wild-type DrHCN4 or DrHCN4L. From top to bottom: DrHCN4 mutant (DrHCN4AAA) only, DrHCN4 (wild-type) + DrHCN4AAA, DrHCN4L (wild-type) + DrHCN4AAA. Wild-type and mutant cRNAs were mixed in a 1:1 ratio with 5 ng each. (D) Averaged current amplitudes at −100 mV were plotted as bar graphs [n = 5 for each except DrHCN4AAA alone (n = 4)]. |

Sensitivities of DrHCN4 and DrHCN4L to HCN inhibitors. (A–C) Representative current traces sequentially applied with 0–100 µM of ivabradine. The holding potential was −30 mV and was hyperpolarized to −120 mV for 2 s. (D) Ivabradine inhibition curves based on currents of (A–C). DrHCN4 (blue; n = 5), DrHCN4L (red; n = 4) and HsHCN4 (black; n = 4). (E–G) Representative current traces sequentially applied with 0 μM–1 mM of ZD7288. The holding potential was −30 mV and was hyperpolarized to −120 mV for 2 s. (H) ZD7288 inhibition curves based on currents of (E–G). DrHCN4 (blue; n = 5), DrHCN4L (red; n = 5) and HsHCN4 (black; n = 5). (I–K) Representative currents sequentially applied with 0 μM–1 mM of cesium ion. The holding potential was −30 mV and was hyperpolarized to −120 mV for 2 s. (L) Cesium ion inhibition curves based on currents of (I–K). DrHCN4 (blue; n = 5), DrHCN4L (red; n = 5) and HsHCN4 (black; n = 5). |

HCN inhibitors reduce heart rate in developing zebrafish embryos. (A) Experimental method. Inhibitors were administered in the egg water at 24 hpf, and this time point was designated as “0 h”. After administering the inhibitors, heart rate was measured at 24 h (24 h) and 48 h (48 h). Zebrafish were then transferred back to the inhibitor-free egg water, and their heart rates were measured 6 h later (washout). (B) Changes in heart rate with time in zebrafish before (control; grey; n = 10) and after treatment with 1 mM cesium ion (pink; n = 10), ZD7288 (orange; n = 10) and ivabradine (green; n = 10) inhibitors. Heart rates before (0 h) and at 24 h (24 h) and 48 h (48 h), after application of the inhibitors and at 6 h after washing out the inhibitors (washout) are shown as bar graphs. Dunnett’s test was used for statistical analysis, and Student’s t-test was used to compare before and after “washout.” (C) Changes in heart rate with time in zebrafish treated with ZD7288 before (gray; n = 10) and after treatment with 10 μM (light orange; n = 10), 100 μM (orange; n = 10), and 1 mM (dark orange; n = 10). Dunnett’s test was used for statistical analysis, and Student’s t-test was used to compare before and after washout. (D) Changes in heart rate with time in zebrafish treated with ivabradine before (gray; n = 10) and after treatment with 10 μM (thin green; n = 10), 100 μM (light green; n = 10) and 1 mM (dark green; n = 10). Dunnett’s test was used for statistical analysis, and Student’s t-test was used to compare before and after washout. |
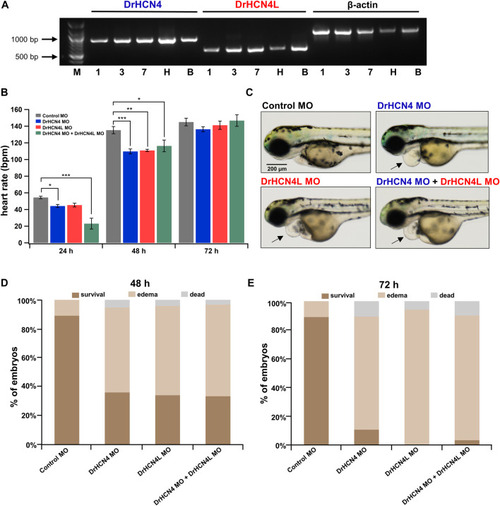
Effects of HCN4 channel knockdown on zebrafish. (A) Expression of DrHCN4 and DrHCN4L in one (1), three (3), and seven (7) day embryos/larvae as well as in the heart (H) and brain (B) of adult fish was confirmed by RT-PCR. Arrows indicate the DNA ladder markers of 1,000 bp and 500 bp. (B) Heart rates at 24, 48, and 72 h are shown in bar graphs for 200 μM MO-injected zebrafish embryos: control MO (n = 20), DrHCN4 MO (n = 10), DrHCN4L MO (n = 10), and mixed DrHCN4 and DrHCN4L MO (n = 10). Statistical analysis was performed by Dunnett’s test. (C) Representative examples of zebrafish injected with control MO, DrHCN4 MO, DrHCN4L MO, and mixed DrHCN4 and DrHCN4L MO. Zebrafish with DrHCN4 MO, DrHCN4L MO, and mixed DrHCN4 and DrHCN4L MO showed pericardial edema (black arrows). Bar, 200 μm. (D) Ratios of normal embryos, pericardial edema, and death at 48 h after injection of 200 µM MO: control MO (n = 136), DrHCN4 MO (n = 75), DrHCN4L MO (n = 34), and mixed DrHCN4 and DrHCN4L MO (n = 30). (E) Pericardial edema and death ratios at 72 h after injection of 200 µM MO. Control MO (n = 136), DrHCN4 MO (n = 75), DrHCN4L MO (n = 34), and mixed DrHCN4 and DrHCN4L MO (n = 30). |