
|
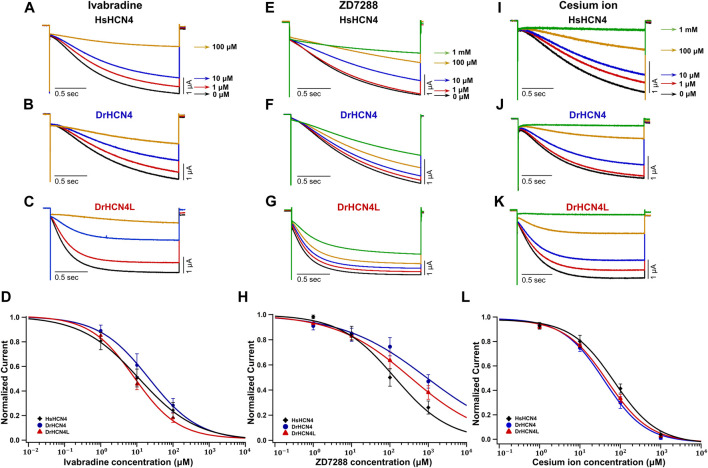
Fig. 4
Sensitivities of DrHCN4 and DrHCN4L to HCN inhibitors. (A–C) Representative current traces sequentially applied with 0–100 µM of ivabradine. The holding potential was −30 mV and was hyperpolarized to −120 mV for 2 s. (D) Ivabradine inhibition curves based on currents of (A–C). DrHCN4 (blue; n = 5), DrHCN4L (red; n = 4) and HsHCN4 (black; n = 4). (E–G) Representative current traces sequentially applied with 0 μM–1 mM of ZD7288. The holding potential was −30 mV and was hyperpolarized to −120 mV for 2 s. (H) ZD7288 inhibition curves based on currents of (E–G). DrHCN4 (blue; n = 5), DrHCN4L (red; n = 5) and HsHCN4 (black; n = 5). (I–K) Representative currents sequentially applied with 0 μM–1 mM of cesium ion. The holding potential was −30 mV and was hyperpolarized to −120 mV for 2 s. (L) Cesium ion inhibition curves based on currents of (I–K). DrHCN4 (blue; n = 5), DrHCN4L (red; n = 5) and HsHCN4 (black; n = 5).