
|
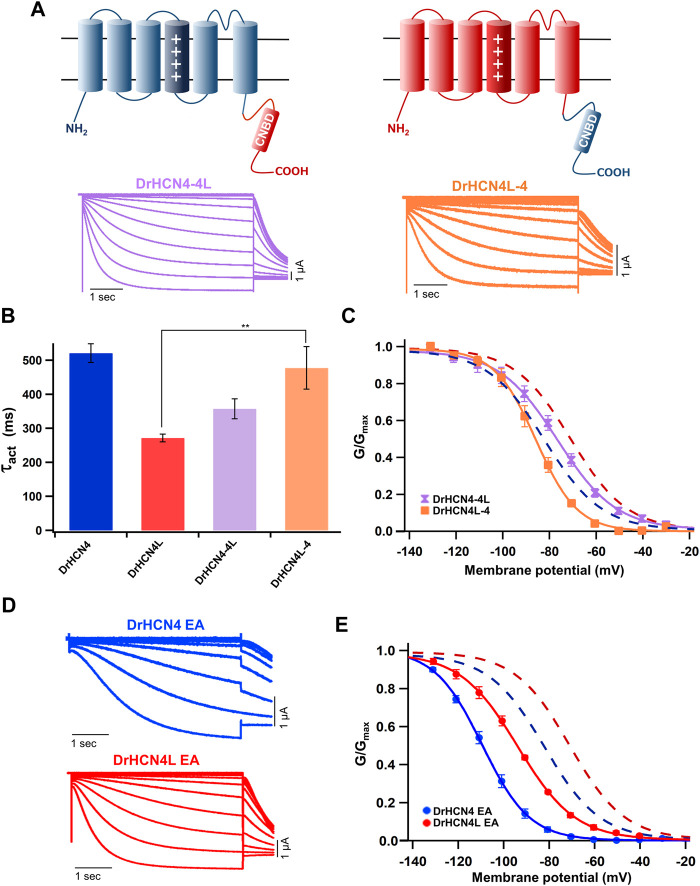
Fig. 2
The cytoplasmic C-terminal region of DrHCN4 and DrHCN4L determines the voltage dependence. (A) Molecular designs and representative currents of chimeric channels: DrHCN4-4L (left, purple) and DrHCN4L (right, orange). (B) Activation time constants (τ act) at −130 mV of DrHCN4 (blue), DrHCN4L (red), DrHCN4-4L (purple) and DrHCN4L-4 (orange). The currents were fitted with a single exponential. (C) Activation curves of the zebrafish chimeric HCN4 channels (n = 5). The Boltzmann function was used to fit the curves. Blue and red dashed curves are the activation curves of DrHCN4 and DrHCN4L from Figure 1C. (D) Representative current traces of the EA mutants, DrHCN4 EA and DrHCN4L EA. (E) Activation curves of the EA mutant channels (n = 5). The Boltzmann function was used to fit the curves. Blue and red dashed curves are the activation curves of DrHCN4 and DrHCN4L from Figure 1C.