
- Title
-
Identification of Novel Vascular Genes Downstream of Islet2 and Nr2f1b Transcription Factors
- Authors
- Li, R.F., Wang, Y.S., Lu, F.I., Huang, Y.S., Chiu, C.C., Tai, M.H., Wu, C.Y.
- Source
- Full text @ Biomedicines
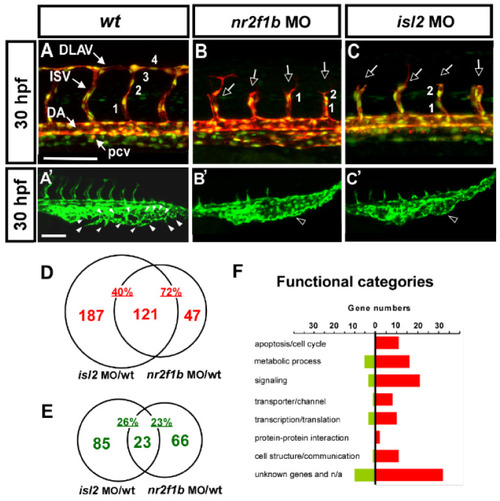
Loss of nr2f1b and isl2 causes vascular defects, and transcriptome analysis identified genes regulated by Nr2f1b and/or Isl2. (A–C,A′–C′) knockdown of isl2 or nr2f1b causes ISV growth stalling in the middle line of the somite, a reduction of the ISV endothelial cells, (B,C) and a mis-patterned vessel plexus at the CVP (B′,C′) at 30–32 hpf when compared to wt controls (A,A′). (D,E) Microarray data analysis in Venn diagrams show that there were 308 and 168 genes upregulated at isl2 MO and nr2f1b MO, respectively, compared to wt, as well as 121 overlapping genes in both isl2 MO and nr2f1b MO when compared to the wild type (D). (E) For the repression targets, 108 and 89 genes are downregulated at isl2 MO and nr2f1b MO, respectively, compared to wt, and 23 genes are overlapped. (F) Functional analysis showed many genes involved in cell cycle regulation, signaling, transporter/channels, transcription, cell communication and protein–protein interactions. (ISV, intersegmental vessel; DLAV, dorsal longitudinal anastomotic vessel; DA, dorsal aorta; PCV, posterior cardinal vein; CVP, caudal vein plexus). Scale bars represent 100 μm. |
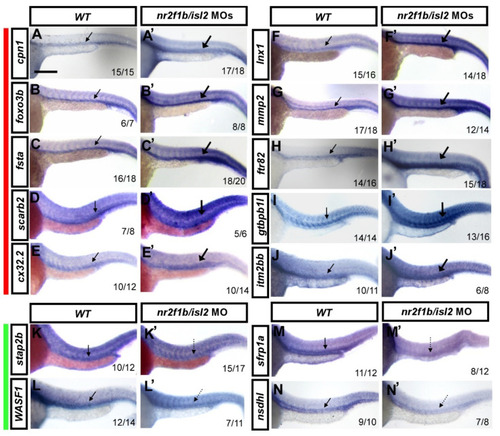
Verification of vascular-specific expression of potential targets in wt and double knockdown isl2/nr2f1b MOs by in situ hybridization. Embryos were injected with a combination of isl2 and nr2f1b morpholinos (8 and 1.7 ng each) and gene expression was examined by in situ hybridization at 24 h post-fertilization. Representative wt control embryos are on the left of each panel and isl2/nr2f1b morpholino (MO)-injected embryos are on the right. ((A–J,A′–J′) red bar aside) The increased expression of (A′) cpn1, (B′) foxo3b, (C′) fsta, (D′) scarb2, (E′) cx32.2, (F′) lnx1, (G′) mmp2, (H′) ftr82, (I′) gtpbp1l, and (J′) itm2bb in the vasculature in isl2/nr2f1b morphants (thick arrows) compared to wild-type embryos (A–J). (K–N,K′–N′ green bar aside) The reduced expression of (K′) stap2b, (L′) WASF1, (M′) sfrp1a, and (N′) nsdhl in the vessels in isl2/nr2f1b morphants (dash arrows) compared to wild-type embryos (K–N). These data consist of the transcriptome results. Values on the bottom indicate the number of embryos exhibiting a phenotype per the total number of embryos analyzed. Scale bar is 200 μm for all figures. |
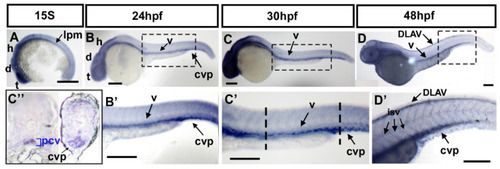
Expression pattern of fsta during zebrafish embryogenesis. (A) The expression of fsta is observed in the lateral plate mesoderm (lpm), the telencephalon (t), diencephalon (d), and hindbrain (h) at the 15S stage embryo. (B,B′) At 24 hpf, fsta is expressed in the head, as well as in vessels (v), and caudal vein plexus (cvp) of the trunk. (B′) is an enlargement of (B). (C,C′) At 30 hpf, fsta expression continues in the head, vessels (v), and CVP of the trunk. (C′) is an enlargement of (C). (C″) Cross sections of embryos from (C′) show that fsta is expressed in the posterior cardinal vein (pcv), and CVP. (D,D′) At 48 hpf, fsta expression in the head, vessels (v), DLAV, and CVP of the trunk. (D′) is an enlargement of (D). Scale bars in all figures represent 200 μm. |
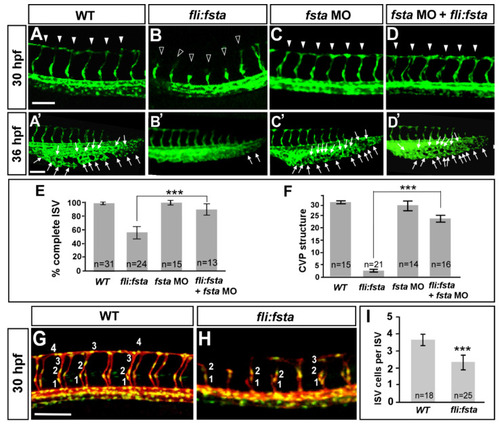
The overexpression of the fsta gene causes defects in vascular development. In uninjected control embryos, intersegmental vessels (ISV) reached the DLAV at the dorsal region from 24–30 hpf ((A), arrowheads) and the caudal vein plexus (CVP) formed honeycomb-like structures at the tail region from about 36–48 hpf ((A′), arrows). At the same stage, the overexpression of fsta driven by the fli promoter caused ISVs’ stalling at the mid-somite ((B), hollow arrowheads) and less/no honeycomb structure formation at the CVP (B′) Knockdown of fsta by morpholino had no obvious defect in the vasculature (C,C′), but rescued the defect of ISV stalling (solid arrowhead) (D) and restored the honeycomb structure at the CVP (D′). (E) The quantification of the percentage of completed ISV at 30 hpf in wild-type embryos (97 ± 2, n = 31), (fli:fsta)-overexpressing embryos (54 ± 8, n = 24), fsta MO (97 ± 3, n = 15), and rescued embryos (84 ± 6, n = 13). (F) Quantification of loop formation (loops and sprouts) at the CVP at 36 hpf showed an 8-fold increase in the rescued embryos (23 ± 3, n = 16) when compared to (fli:fsta) embryos (3 ± 1, n = 21); fsta MO (28 ± 4, n = 14) has no difference when compared to wild-type embryos (30 ± 2, n = 15). (G,H) Imaging of endothelial nuclei in green and vessels in red at 30 hpf in wild-type controls and (fli:fsta)-overexpressing embryos using Tg(kdrl:mCherryci5; fli1a:nEGFP y7) double transgenic line. (fli:fsta) embryos showed reduced ISV nuclei numbers (H). (I) Quantification of ISV nuclei number in (fli:fsta) embryos (n = 25) when compared to wild-type controls (n = 18). Data are represented as means ± S.E. *** refers to p< 0.0001 by an unpaired Student’s t-test. Scale bars are 100 μm for (A–D,A′–D′,G,H). |
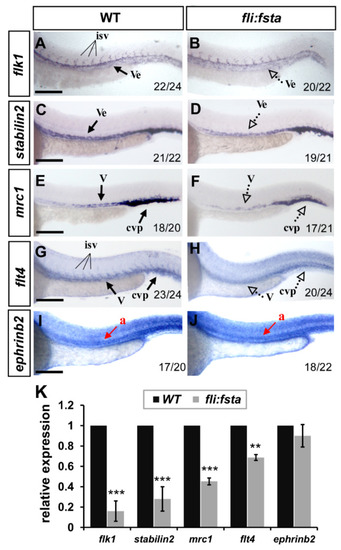
fli, driving fsta-overexpressing (fli:fsta) fish, remodeled the expression of vascular markers. (A–J) When compared to wild type controls (A,C,E,G,I), the expression of the pan-vascular markers flk1 and stabilin2 at the vessels (ve) and caudal vein plexus (cvp) were decreased in (fli:fsta)-overexpressed fish at 24 hpf (A–D). In addition, the expression of venous markers mrc1 (E,F) and flt4 (G,H) were reduced in the posterior cardinal vein (v) and caudal vein plexus (cvp) in (fli:fsta)-overexpressed fish at 24 hpf. The expression of the arterial marker ephrinb2 (I,J) is not changed. Values on the bottom indicate the number of embryos exhibiting a phenotype per the total number of embryos analyzed. Scale bars represent 200 μm in (A–J). (K) Quantification of the relative expression level by qPCR assay showed a ~50 to 80% reduced expression in the vascular markers flk1 (0.16 ± 0.1), stabilin2 (0.28 ± 0.12), mrc1 (0.45 ± 0.03), and flt4 (0.69 ± 0.03) in (fli:fsta) embryos; the expression of ephrinb2 (0.9 ± 0.11) in (fli:fsta) embryos is unchanged when compared to wild-type. qPCR data are presented as the mean ± S.D. *** Refers to p < 0.0001 and ** refers to p < 0.001 by an unpaired Student’s t test. |
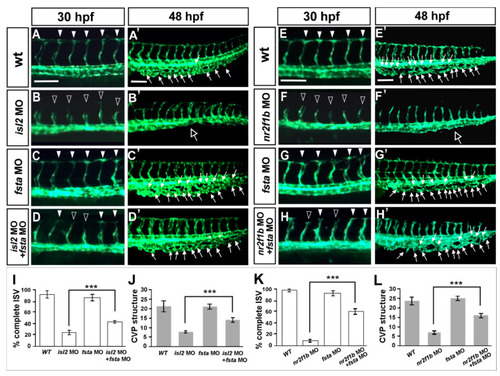
Knockdown of fsta rescues the vascular defects in isl2 and nr2f1b morphants. When compared to vascular patterns in wild type embryos (A,A′,E,E′,), the loss of fsta by morpholino injection does not cause obvious vascular defects (C,C’,G,G’), and the knockdown of isl2 or nr2f1b showed ISV growth defects at 30 hpf (B,F) and CVP mis-patterning (hollow arrows in (B′,F′)). Double knockdown of fsta and isl2 (fsta MO + isl2 MO) or fsta and nr2f1b (fsta MO + nr2f1b MO) showed less ISV stalling (D,H) when compared to isl2 MO or nr2f1b MO. (I–L) Quantitative results showed the significant rescue effect of isl2 MO or nr2f1b MO by fsta morpholino injection. Quantitated results for isl2 MO rescue experiments in wt (n = 10), fsta MO (n = 18), isl2 MO (n = 13), and fsta MO + isl2 MO (n = 15). For the quantification of nr2f1b MO rescue experiment: wt (n = 10), fsta MO (n = 18), nr2f1b MO (n = 15), fsta MO + nr2f1b MO (n = 13). These data are consistent with our microarray results; isl2 and nr2f1b negatively regulate fsta expression to control ISV/vein development. Data are represented as means ± S.E. *** refers to p < 0.0001 by an unpaired Student’s t-test. Scale bars represent 100 μm in (A–H,A′–H′). |
Knockdown of fsta rescues the vascular defects in isl2 and nr2f1b morphants. When compared to vascular patterns in wild type embryos (A,A′,E,E′,), the loss of fsta by morpholino injection does not cause obvious vascular defects (C,C’,G,G’), and the knockdown of isl2 or nr2f1b showed ISV growth defects at 30 hpf (B,F) and CVP mis-patterning (hollow arrows in (B′,F′)). Double knockdown of fsta and isl2 (fsta MO + isl2 MO) or fsta and nr2f1b (fsta MO + nr2f1b MO) showed less ISV stalling (D,H) when compared to isl2 MO or nr2f1b MO. (I–L) Quantitative results showed the significant rescue effect of isl2 MO or nr2f1b MO by fsta morpholino injection. Quantitated results for isl2 MO rescue experiments in wt (n = 10), fsta MO (n = 18), isl2 MO (n = 13), and fsta MO + isl2 MO (n = 15). For the quantification of nr2f1b MO rescue experiment: wt (n = 10), fsta MO (n = 18), nr2f1b MO (n = 15), fsta MO + nr2f1b MO (n = 13). These data are consistent with our microarray results; isl2 and nr2f1b negatively regulate fsta expression to control ISV/vein development. Data are represented as means ± S.E. *** refers to p < 0.0001 by an unpaired Student’s t-test. Scale bars represent 100 μm in (A–H,A′–H′). |