
Fig. 5
- ID
- ZDB-FIG-220627-46
- Publication
- Li et al., 2022 - Identification of Novel Vascular Genes Downstream of Islet2 and Nr2f1b Transcription Factors
- Other Figures
- All Figure Page
- Back to All Figure Page
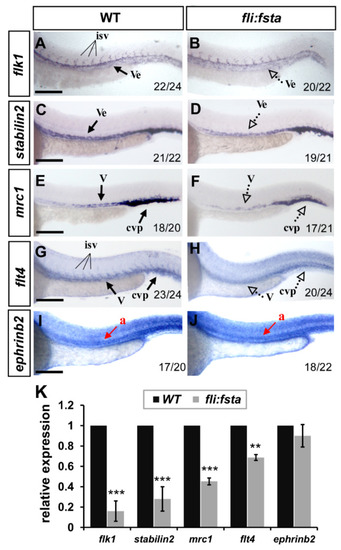
fli, driving fsta-overexpressing (fli:fsta) fish, remodeled the expression of vascular markers. (A–J) When compared to wild type controls (A,C,E,G,I), the expression of the pan-vascular markers flk1 and stabilin2 at the vessels (ve) and caudal vein plexus (cvp) were decreased in (fli:fsta)-overexpressed fish at 24 hpf (A–D). In addition, the expression of venous markers mrc1 (E,F) and flt4 (G,H) were reduced in the posterior cardinal vein (v) and caudal vein plexus (cvp) in (fli:fsta)-overexpressed fish at 24 hpf. The expression of the arterial marker ephrinb2 (I,J) is not changed. Values on the bottom indicate the number of embryos exhibiting a phenotype per the total number of embryos analyzed. Scale bars represent 200 μm in (A–J). (K) Quantification of the relative expression level by qPCR assay showed a ~50 to 80% reduced expression in the vascular markers flk1 (0.16 ± 0.1), stabilin2 (0.28 ± 0.12), mrc1 (0.45 ± 0.03), and flt4 (0.69 ± 0.03) in (fli:fsta) embryos; the expression of ephrinb2 (0.9 ± 0.11) in (fli:fsta) embryos is unchanged when compared to wild-type. qPCR data are presented as the mean ± S.D. *** Refers to p < 0.0001 and ** refers to p < 0.001 by an unpaired Student’s t test. |