
- Title
-
Cichoric Acid May Play a Role in Protecting Hair Cells from Ototoxic Drugs
- Authors
- Lai, T.W., Cheng, H.L., Su, T.R., Yang, J.J., Su, C.C.
- Source
- Full text @ Int. J. Mol. Sci.
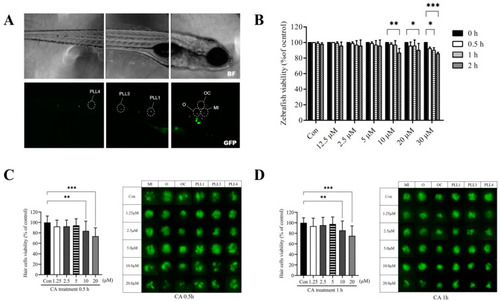
Effects of CA on transgenic zebrafish larvae and hair cell viability. (A) Fluorescence micrograph of a 7-dpf transgenic zebrafish larvae. The analyzed lateral line hair cells in zebrafish are marked by a white circle: otic (O), occipital (OC), middle (MI), and posterior lateral line (PLL1, PLL3, and PLL4). Scale bar: 100 μm. (B) 7-dpf transgenic zebrafish larvae were treated with CA (0, 1.25, 2.5, 5, 10, 20, and 30 μM) for different time (0.5, 1, and 2 h). After the exposure period, viable fish were counted and presented as a percentage of the untreated control. (C) Lateral line hair cells were treated with CA (0, 1.25, 2.5, 5, 10, and 20 μM) for 0.5 h and (D) 1 h. Fluorescence micrographs of lateral line hair cells from neuromasts (O, OC, MI, PLL1, PLL3, and PLL4) (right panel) were analyzed and the quantitative result of viable hair cells was present as a percentage of the untreated control (left panel). All values of the experimental groups were presented as mean ± SD. * p < 0.05, ** p < 0.01, and *** p < 0.001 as compared with untreated control. CA, CA; O, otic; OC, occipital; MI, middle; and PLL, posterior lateral line. |

CA protected against neomycin-induced lateral line hair cell loss. (A) Transgenic zebrafish larvae were fixed and photographed using a fluorescence microscope. 7-dpf transgenic zebrafish larvae were treated with 12.5 μM of neomycin only for 0.5 h or pre-treated with CA (0, 1.25, 2.5, 5, and 10 μM) for 0.5 h, (B) 1 h, and (C) 2 h, respectively. (D) 7-dpf transgenic zebrafish larvae were treated with 12.5 μM of neomycin only for 0.5 h or pretreated with 5 μM CA for different times (0, 0.5, 1, 2, 3, 4, 5, and 24 h). (E) 7-dpf transgenic zebrafish larvae were pretreated with 5 μM of CA for 1, 2, and 3 h followed by CA washout, and subsequently 0.5 h of 12.5 μM neomycin treatment. Fluorescence micrographs of lateral line hair cells from neuromasts (O, OC, MI, PLL1, PLL3, and PLL4) (right panel) were analyzed and the quantitative result of viable hair cells was present as a percentage of the untreated control (left panel). All values of the experimental groups were presented as mean ± SD. ** p < 0.01, *** p < 0.001, and ns, no significant difference as compared with untreated control. PHENOTYPE:
|

Evaluation of CA protected against neomycin-induced apoptosis and mechanotransduction channel impairment. (A) Fluorescence photograph of hair cells in neuromasts of 7-dpf transgenic zebrafish larvae treated with 12.5 μM of neomycin for 0.5 h only or pre-treated with 5 μM CA for 2 h. Labeling FM4-64 fluorescence dye that passes through hair’s h mechanotransduction channel was market d as a red-color signal. A comparison of the signal intensity between untreated control, neomycin, and neomycin pre-treated with CA for 2 h showed that CA prevented neomycin-induced mechanotransduction channel impairment. Scale bar: 10 μm. (B) Apoptotic hair cells were marked as light-respotsot (middle le) in the anterior region of the lateral line system after TUNEL staining. The location of the oval window (ov) and eye a were marked by the white circle. Comparison of TUNEL-positive signal intensity between untreated control, neomycin, and neomycin pre-treated with CA for 2 h showed that CA prevented neomycin-induced apoptosis of TUNEL-positive cells. Scale bar: 100 μm. PHENOTYPE:
|
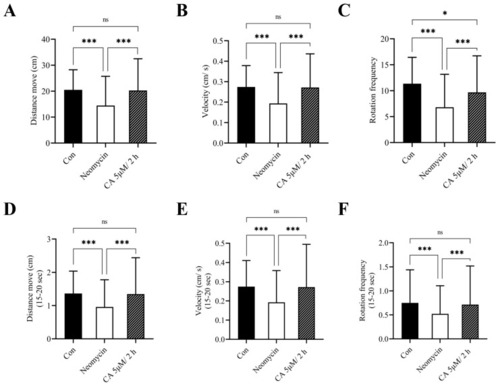
Otoprotective effects of CA on locomotor behavior of transgenic zebrafish larvae. After the exposure period, the transgenic zebrafish larvae were individually transferred into a 12-well plate and examined the behavioral parameters including (A) distance moved, (B) velocity, and (C) rotation frequency in response to sound and vibration stimulus caused by the tapping device. Short-time (D–F) escapes response within 15 s were confirmed and consisted of (A–C). All values of experimental groups were presented as mean ± SD. * p < 0.05, *** p < 0.001 and ns, no significant difference as the comparison between indicated group. PHENOTYPE:
|