
- Title
-
Lactate modulates microglia polarization via IGFBP6 expression and remodels tumor microenvironment in glioblastoma
- Authors
- Longhitano, L., Vicario, N., Forte, S., Giallongo, C., Broggi, G., Caltabiano, R., Barbagallo, G.M.V., Altieri, R., Raciti, G., Di Rosa, M., Caruso, M., Parenti, R., Liso, A., Busi, F., Lolicato, M., Mione, M.C., Li Volti, G., Tibullo, D.
- Source
- Full text @ Cancer Immunol Immunother
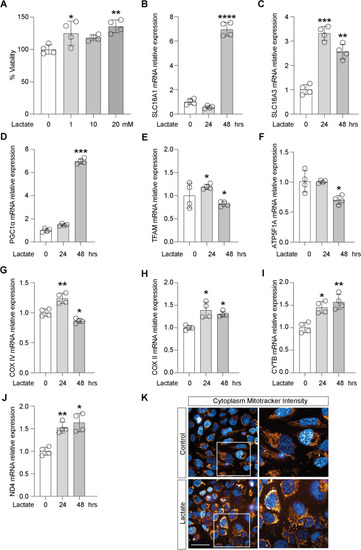
Lactate induces the expression of MCT1, promoting an oxidative metabolism in microglia cells. Effect of Lactate on A cell viability, B SLC16A1 (MCT1) and C SLC16A3 (MCT4) mRNA expression levels, in microglia cells. Evaluation of relative mRNA expression levels of D PGC1a, E TFAM, F ATP5F1A, G COX IV, H COX II, I CYTB, J ND4, following 24 and 48 h of lactate exposition, analyzed by Real-time PCR. The calculated value of 2−ΔΔCt in untreated controls is 1. K Cytoplasm Mitotracker Intensity. Data are expressed as mean ± SD of at least four independent experiments. (*P < 0.05; **P < 0.005; ***P < 0.001; ****P < 0.0001). Scale bars in K 10 μm |
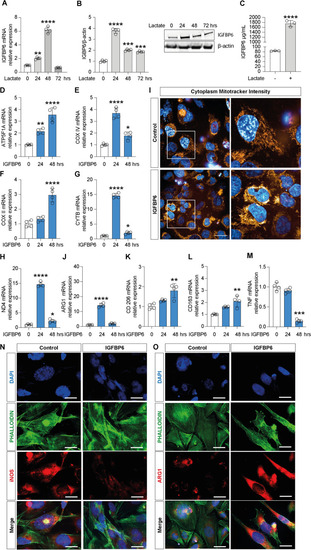
Lactate induces IGFBP6 expression which promotes M2-like phenotype polarization of microglia. Effect of lactate on IGFBP6 A mRNA expression levels, B protein expression and C production in microglia cells. Evaluation of relative mRNA expression levels of D ATP5F1A, E COX IV, F COX II, G CyTB, H ND4. I Cytoplasm Mitotracker Intensity. Evaluation of relative mRNA expression levels of J Arg1, K CD 206, L CD 163 and M TNF, analyzed by real-time PCR. The calculated value of 2−ΔΔCt in untreated controls is 1. Immunocytochemistry analysis of N iNOS and O Arg1, following 72 h of IGFBP6 treatment. Data are expressed as mean ± SD of at least four independent experiments. (*P < 0.05; **P < 0.005; ***P < 0.001; ****P < 0.0001). Scale bars in (I, N and O) 10 μm |
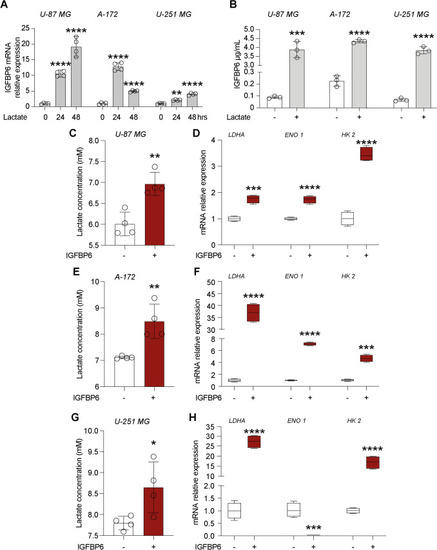
Lactate and IGFBP6 crosstalk. Effect of lactate on IGFBP6 A mRNA expression levels and B production in Glioblastoma cells. Effect of IGFBP6 treatment on lactate production in (C) U-87 MG, E A-172 and G U-251 MG cells. Evaluation of mRNA expression levels of LDHA, ENO1 and HK2 in D U-87 MG, F A-172 and H U-251 MG cells |
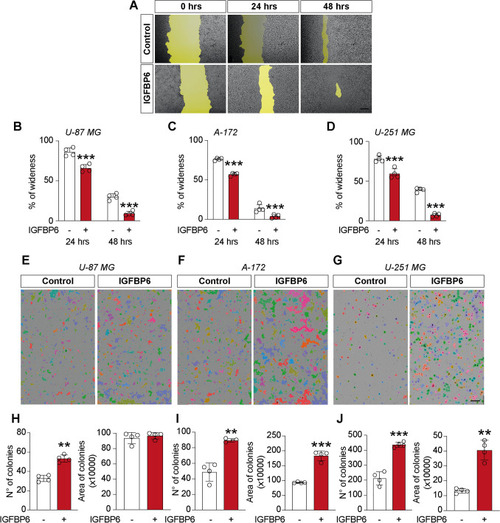
IGFBP6 enhances migratory and colony formation capacity in glioblastoma cells. Effect of IGFBP6 treatment on migratory capacity A–D and colony formation capacity G–H in Glioblastoma cells. Data are expressed as mean ± SD of at least four independent experiments. (*P < 0.05; **P < 0.005; ***P < 0.001; ****P < 0.0001). Scale bar in (A) 100 μm and scale bar in (E, F and G) 1 mm |
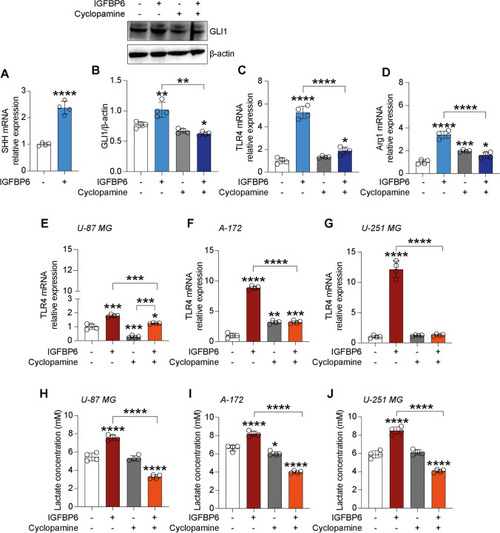
IGFBP6 increases sonic hedgehog signalling pathway activation in GBM and microglia.Evaluation of mRNA expression levels of SHH in microglia cells treated with IGFBP6 A, and GLI1 protein expression after IGFBP6 and cyclopamine treatment B. Evaluation of mRNA expression levels of TLR4 C and ARG1 D after IGFBP6 and cyclopamine treatment in microglia cells. Evaluation of mRNA expression levels of TLR4 after IGFBP6 and cyclopamine treatment in U-87 MG E, A-172 F and U-251 MG G cells. Effect of IGFBP6 and cyclopamine treatment on lactate production in U-87 MG H, A-172 I and U-251 MG J cells. Data are expressed as mean ± SD of at least four independent experiments. (*P < 0.05; **P < 0.005; ***P < 0.001; ****P < 0.0001) |
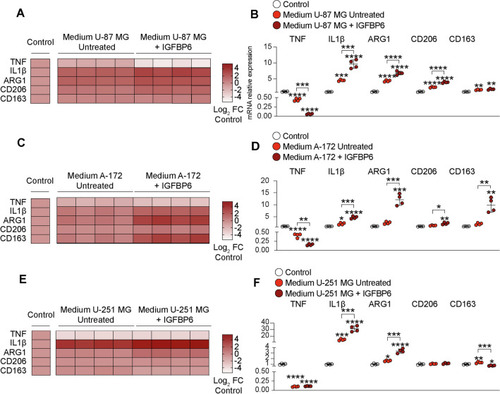
IGFBP6 produced by glioblastoma cells promote microglia M2-like phenotype polarization.Evaluation of mRNA expression levels of TNF, IL1β, ARG1, CD206 and CD163 in microglia cells treated with conditioned medium of A-B U-87 MG, C-D A-172, E-F U-251 MG pre-treated with IGFBP6. Data are expressed as mean ± SD of at least four independent experiments. (*P < 0.05; **P < 0.005; ***P < 0.001; ****P < 0.0001) |
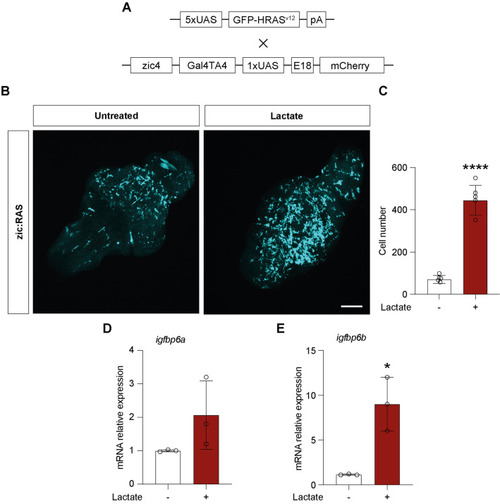
Lactate induces changes in microglia and igfbp6b expression in a zebrafish brain tumor model A Schematic representation of the genetic components of the zebrafish GBM model; B whole mount immunofluorescence of microglia (cyano) in zic:Ras larval brains treated as indicated; C count of microglia cells in whole zic:RAS control brains and treated with 20 mM lactate, data represent the means of counts performed on 5 biological replicates for each condition; d) gene expression analysis of igfbp6a and igfbp6b in 5dpf zic:Ras control larvae and treated with 20 mM lactate. (****P < 0.0001; *P < 0.01). Scale bar in B 40 μm |
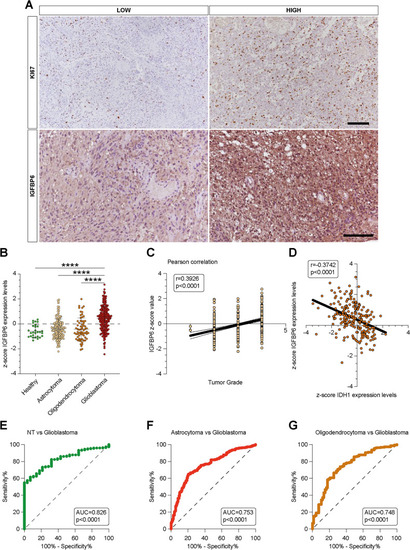
IGFBP6 was modulated in GBM patients.Analysis of IGFBP6 gene expression in brain biopsies of patients with astrocytoma, oligodendrocytoma, glioblastoma, and healthy subjects. b Pearson correlation analysis between IGFBP6 expression levels and tumor grade of brain biopsies obtained from patients affected by main brain tumors. c Pearson's correlation between IGFBP6 and IDH1 expression levels in brain biopsies of patients with glioblastoma. d Receiver operating characteristic (ROC) analysis between IGFBP6 brain expression levels in healthy subjects vs glioblastoma patients, between glioblastoma patients vs astrocytoma patients e, and vs oligodendrocytoma f. Data are expressed as mean ± SD of at least four independent experiments. (*P < 0.05; **P < 0.005; ***P < 0.001; ****P < 0.0001). Scale bar in A 50 μm |