
|
Fig. 1
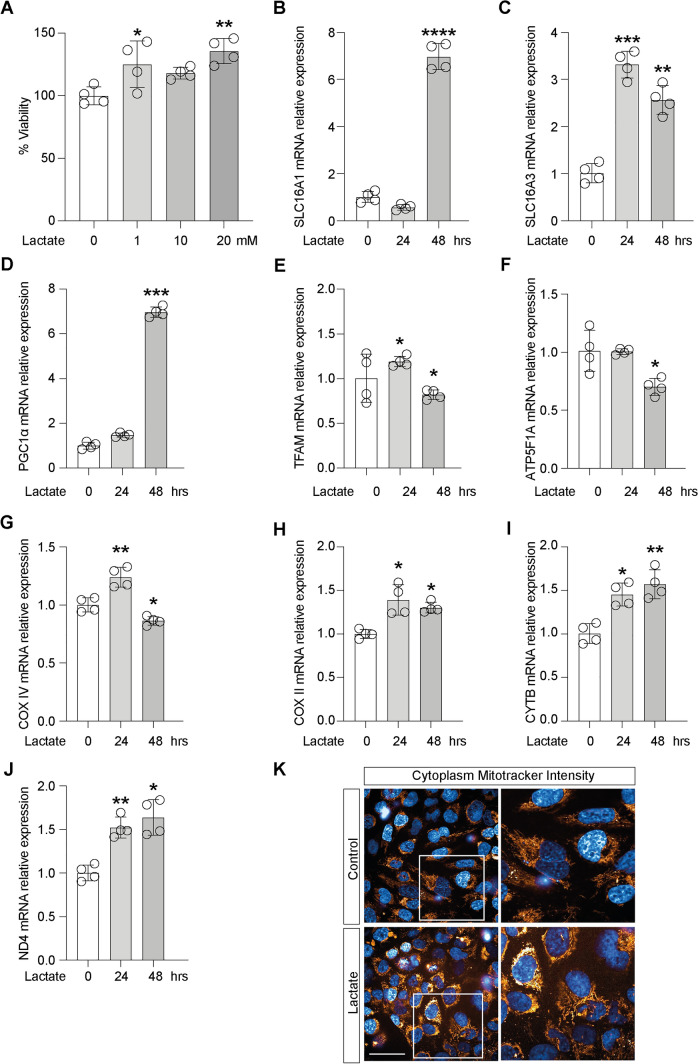
Lactate induces the expression of MCT1, promoting an oxidative metabolism in microglia cells. Effect of Lactate on A cell viability, B SLC16A1 (MCT1) and C SLC16A3 (MCT4) mRNA expression levels, in microglia cells. Evaluation of relative mRNA expression levels of D PGC1a, E TFAM, F ATP5F1A, G COX IV, H COX II, I CYTB, J ND4, following 24 and 48 h of lactate exposition, analyzed by Real-time PCR. The calculated value of 2−ΔΔCt in untreated controls is 1. K Cytoplasm Mitotracker Intensity. Data are expressed as mean ± SD of at least four independent experiments. (*P < 0.05; **P < 0.005; ***P < 0.001; ****P < 0.0001). Scale bars in K 10 μm