
|
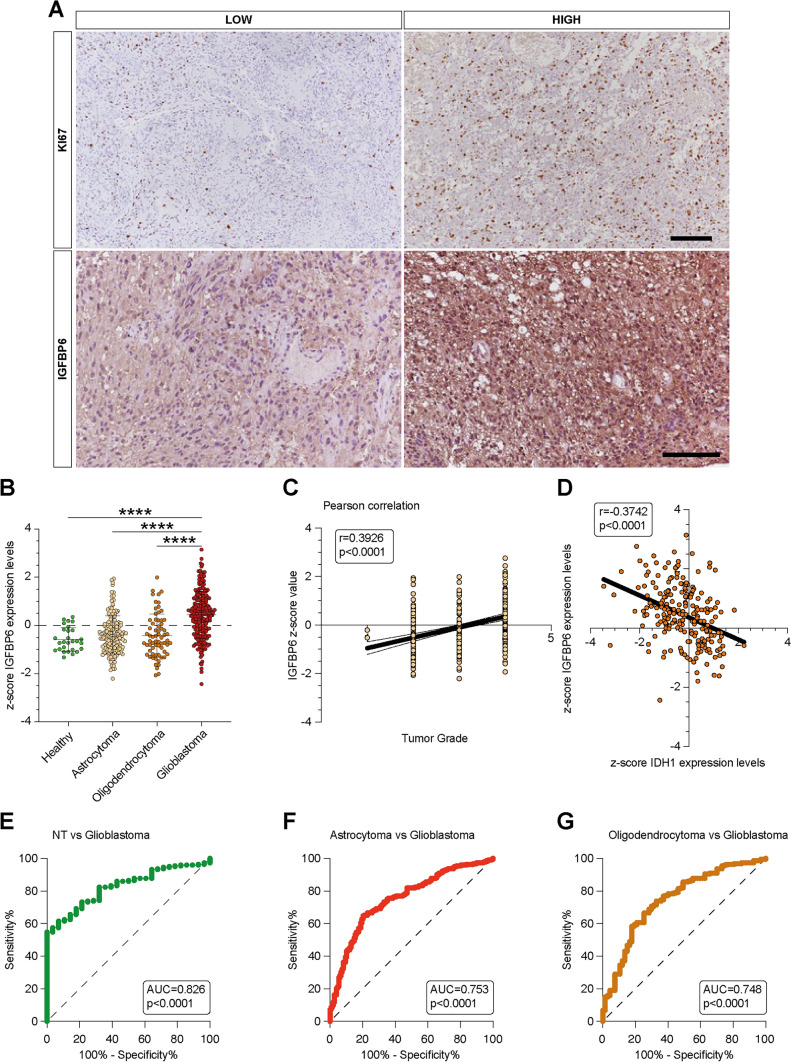
Fig. 8
IGFBP6 was modulated in GBM patients.Analysis of IGFBP6 gene expression in brain biopsies of patients with astrocytoma, oligodendrocytoma, glioblastoma, and healthy subjects. b Pearson correlation analysis between IGFBP6 expression levels and tumor grade of brain biopsies obtained from patients affected by main brain tumors. c Pearson's correlation between IGFBP6 and IDH1 expression levels in brain biopsies of patients with glioblastoma. d Receiver operating characteristic (ROC) analysis between IGFBP6 brain expression levels in healthy subjects vs glioblastoma patients, between glioblastoma patients vs astrocytoma patients e, and vs oligodendrocytoma f. Data are expressed as mean ± SD of at least four independent experiments. (*P < 0.05; **P < 0.005; ***P < 0.001; ****P < 0.0001). Scale bar in A 50 μm