
Image
|
Figure Caption
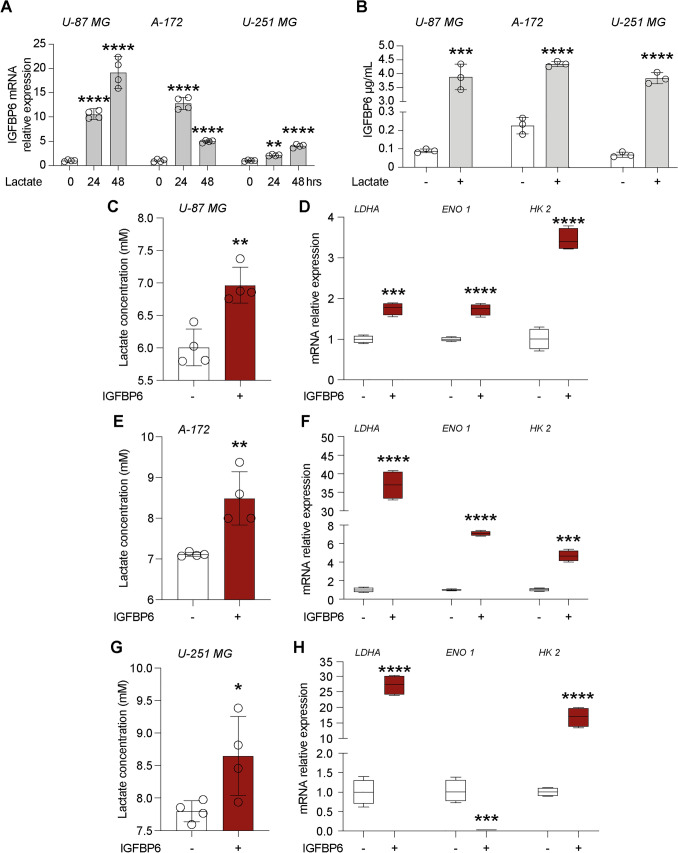
Fig. 3
Lactate and IGFBP6 crosstalk. Effect of lactate on IGFBP6 A mRNA expression levels and B production in Glioblastoma cells. Effect of IGFBP6 treatment on lactate production in (C) U-87 MG, E A-172 and G U-251 MG cells. Evaluation of mRNA expression levels of LDHA, ENO1 and HK2 in D U-87 MG, F A-172 and H U-251 MG cells
Acknowledgments
This image is the copyrighted work of the attributed author or publisher, and
ZFIN has permission only to display this image to its users.
Additional permissions should be obtained from the applicable author or publisher of the image.
Full text @ Cancer Immunol Immunother