FIGURE SUMMARY
Title

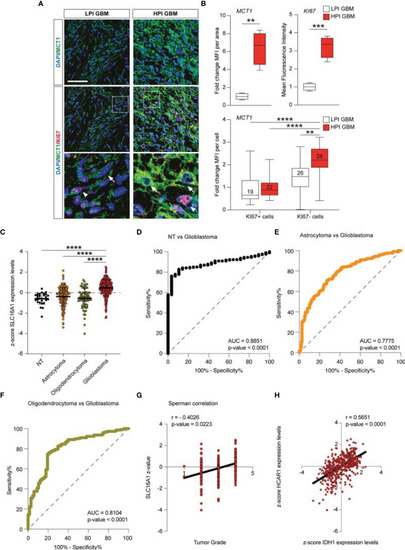
Lactate Induces the Expressions of MCT1 and HCAR1 to Promote Tumor Growth and Progression in Glioblastoma

Authors
Longhitano, L., Vicario, N., Tibullo, D., Giallongo, C., Broggi, G., Caltabiano, R., Barbagallo, G.M.V., Altieri, R., Baghini, M., Di Rosa, M., Parenti, R., Giordano, A., Mione, M.C., Li Volti, G.
Source
Full text @ Front Oncol

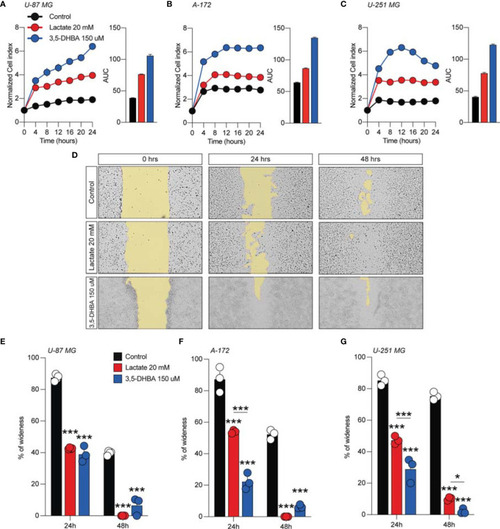
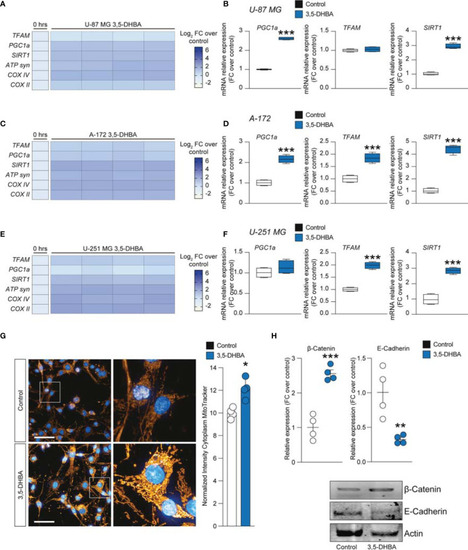
Lactate and 3,5-dihydroxybenzoic acid (3,5-DHBA) promoted glioblastoma cell proliferation and migration. (A–C) Real-time cell proliferation monitoring in U-87 MG cells (A), A-172 cells (B), and U-251 cells (C) using the xCELLigence system following treatments with lactate (20 mM) and 3,5-DHBA (150 μM). The cell index values were normalized at the time of pharmacological treatments in order to obtain a normalized cell index. Each line expresses the average of four different experiments. (E–G) Analysis of human glioblastoma cell migration in U-87 MG cells (E), A-172 cells (D–F), and U-251 MG cells (G) with the wound healing assay following treatments with lactate (20 mM) and 3,5-DHBA (150 μM). The figures presented are representative of at least three independent experiments (mean ± SEM). P-values <0.05 were considered as statistically significant (*p < 0.05; ***p < 0.001).

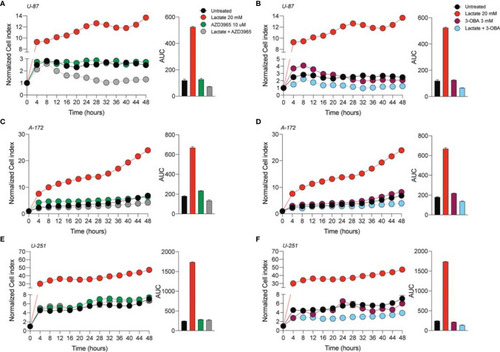
AZD3965 and 3-OBA reduced glioblastoma cell proliferation. (A–F) Real-time cell proliferation monitoring in U-87 MG cells (A, B), A-172 cells (C, D), and U-251 cells (E, F) using the xCELLigence system following treatments with lactate (20 mM), AZD3965 (10 μM), and 3-OBA (3 mM). The cell index values were normalized at the time of pharmacological treatments in order to obtain a normalized cell index. Each line expresses the average of four different experiments.

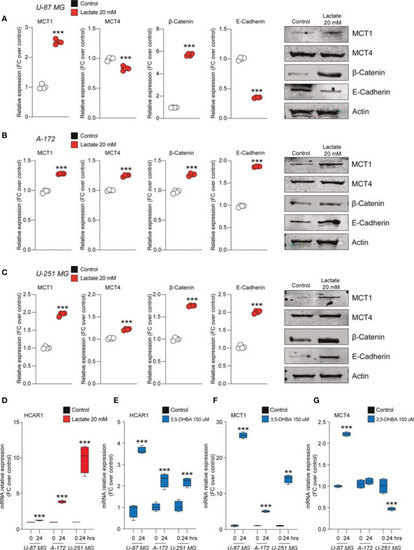
Lactate regulated the expression of monocarboxylate transporters (MCTs) and epithelial–mesenchymal transition (EMT) markers in glioblastoma cells. (A–C) Protein expressions of MCT1, MCT4, β-catenin, and E-cadherin in U-87 MG cells (A), A-172 cells (B), and U-251 MG cells (C) following 72 h of lactate (20 mM) treatment. The figures presented are representative of at least four independent experiments, and values represent the mean ± SEM of experiments performed in quadruplicate. (D)HCAR1 gene expression in U-87 MG, A-172, and U-251 MG cells following 24 h of lactate (20 mM) treatment. (E–G) Gene expressions of HCAR1(E), MCT1(F), and MCT4(G) in U-87 MG, A172, and U-251 MG cells following 24 h of 3,5-dihydroxybenzoic acid (3,5-DHBA, 150 μM) treatment. Values represent the mean ± SEM of experiments performed in quadruplicate. P-values <0.05 were considered as statistically significant (**p < 0.01; ***p < 0.001 vs. untreated).

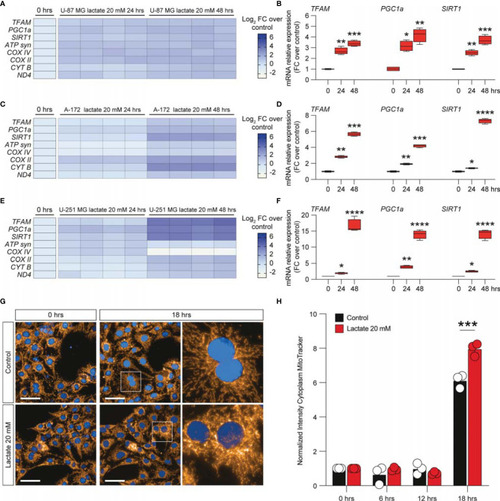
Lactate promoted the upregulation of mitochondrial activity gene expressions in glioblastoma cells. (A–F) Effect of lactate (20 mM) on mitochondrial biogenesis and OXPHOS gene expression in U-87 MG cells (A, B), A-172 cells (C, D), and U-251 MG cells (E, F) following 24 and 48 h of treatment. (G, H) Computerized analysis of the MitoTracker fluorescence intensity in the control versus lactate 18 h after treatment. The figures presented are representative of at least three independent experiments. Values represent the mean ± SEM of experiments performed in quadruplicate. P-values <0.05 were considered as statistically significant (*p < 0.05; **p < 0.01; ***p < 0.001 ; ****p < 0.0001 vs. untreated).

HCAR1 selective stimulation promoted the upregulation of mitochondrial activity gene expressions and regulated the protein expressions of the epithelial–mesenchymal transition (EMT) markers in glioblastoma cells. (A–F) Effect of 3,5-dihydroxybenzoic acid (3,5-DHBA, 150 μM) on mitochondrial biogenesis and OXPHOS gene expression in U-87 MG cells (A, B), A-172 cells (C, D), and U-251 MG cells (E, F) following 24 h of treatment. (G) Computerized analysis of the MitoTracker fluorescence intensity on the control versus lactate 18 h after treatment. The figures presented are representative of at least three independent experiments. (H) Protein expressions of β-catenin and E-cadherin in A-172 cells following 72 h of HCAR1 stimulation. The figures presented are representative of at least four independent experiments, and values represent the mean ± SEM of experiments performed in quadruplicate. P-values <0.05 were considered as statistically significant (*p < 0.05; **p < 0.01; ***p < 0.001 vs. untreated).

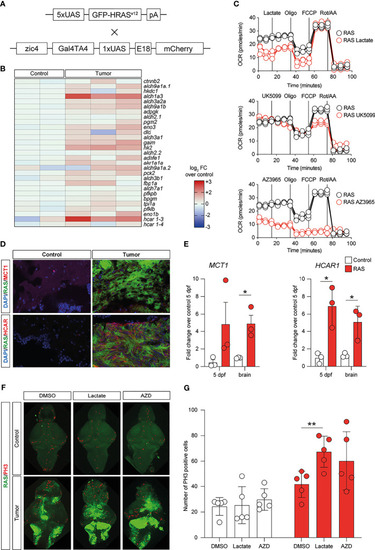
Metabolic changes in a zebrafish model of glioblastoma (GBM) led to increased glycolysis and lactate transport and sensing. (A) Schematic representation of the genetic components of the zebrafish GBM model (Mayrhofer et al., 2017). (B) Increased expression of several members of the glycolytic pathway in GBM. Heatmap representing 29 glycolysis genes and their relative expression levels. (C) Analysis of mitochondrial metabolism (acute Mito Stress test) of tumor cells with the Seahorse XP technology. Each experiment was performed in triplicate and normalized to the number of cells. (D) Increased levels of HCAR1 in tumors vs. control as visualized by immunofluorescence. Staining as detailed in the figures, which are representative of at least three different experiments. (E) Gene expression analysis through quantitative PCR (qPCR) expressed as fold changes compared to controls, at 5 days post-fertilization and in adult tumors. Values represent the mean ± SEM of experiments performed in triplicate. P-values <0.05 were considered as statistically significant (*p < 0.05 vs. controls). (F) Whole-mount immunofluorescence of Ph3 proliferating cells in controls and in HRAS-overexpressing larvae treated or not with 20 mM lactate. Green fluorescence represents tumoral cells expressing eGFP-HRASG12V. (G) Number of proliferating cells in the brains treated as indicated.

MCT1 expression analysis from the human brain tumor GSE108474 dataset. (A) Analysis of the MCT1 gene expression in brain biopsies of patients with astrocytoma, oligodendrocytoma, and glioblastoma (GBM) and in healthy subjects. (B) Pearson’s correlation analysis between the expression levels of MCT1 and the tumor grade of brain biopsies obtained from patients affected by main brain tumors. (C) Pearson’s correlation between the expression levels of MCT1 and IDH1 in brain biopsies of patients with GBM. (D–F) Receiver operating characteristic (ROC) analysis between the expression levels of MCT1 in the brain in healthy subjects vs. GBM patients (D), between GBM patients vs. astrocytoma patients (E), and between GMB patients vs. oligodendrocytoma patients (F). (G) Sperman correlation of SLC16A1 z-value and tumor grade. (H) Correlation between HCAR1 and IDH1 expression levels. Data are expressed as the mean ± SD of at least four independent experiments (**p < 0.005; ***p < 0.001; ****p < 0.0001)..

Acknowledgments
This image is the copyrighted work of the attributed author or publisher, and ZFIN has permission only to display this image to its users. Additional permissions should be obtained from the applicable author or publisher of the image. Full text @ Front Oncol