FIGURE

Figure 3

ID
ZDB-FIG-220518-41
Publication
Longhitano et al., 2022 - Lactate Induces the Expressions of MCT1 and HCAR1 to Promote Tumor Growth and Progression in Glioblastoma
Other Figures
All Figure Page
Back to All Figure Page
Figure 3

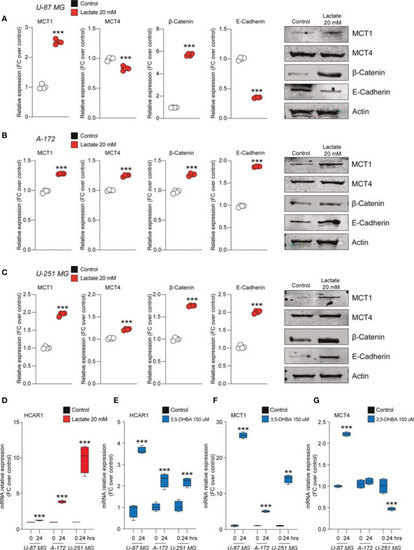
Lactate regulated the expression of monocarboxylate transporters (MCTs) and epithelial–mesenchymal transition (EMT) markers in glioblastoma cells. (A–C) Protein expressions of MCT1, MCT4, β-catenin, and E-cadherin in U-87 MG cells (A), A-172 cells (B), and U-251 MG cells (C) following 72 h of lactate (20 mM) treatment. The figures presented are representative of at least four independent experiments, and values represent the mean ± SEM of experiments performed in quadruplicate. (D)HCAR1 gene expression in U-87 MG, A-172, and U-251 MG cells following 24 h of lactate (20 mM) treatment. (E–G) Gene expressions of HCAR1(E), MCT1(F), and MCT4(G) in U-87 MG, A172, and U-251 MG cells following 24 h of 3,5-dihydroxybenzoic acid (3,5-DHBA, 150 μM) treatment. Values represent the mean ± SEM of experiments performed in quadruplicate. P-values <0.05 were considered as statistically significant (**p < 0.01; ***p < 0.001 vs. untreated).

Expression Data

Expression Detail
Antibody Labeling
Phenotype Data

Phenotype Detail
Acknowledgments
This image is the copyrighted work of the attributed author or publisher, and ZFIN has permission only to display this image to its users. Additional permissions should be obtained from the applicable author or publisher of the image. Full text @ Front Oncol