IMAGE

Figure 4

ID
ZDB-IMAGE-220518-44
Source
Figures for Longhitano et al., 2022
Image
Figure Caption

Figure 4

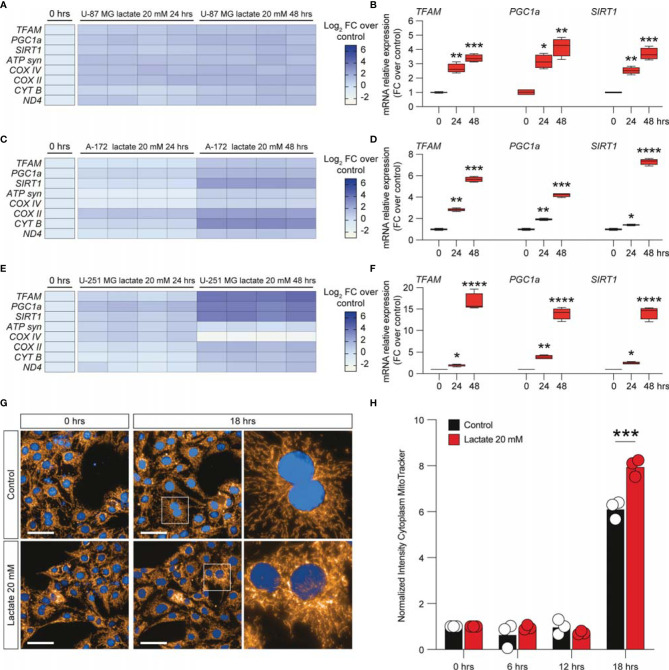
Lactate promoted the upregulation of mitochondrial activity gene expressions in glioblastoma cells. (A–F) Effect of lactate (20 mM) on mitochondrial biogenesis and OXPHOS gene expression in U-87 MG cells (A, B), A-172 cells (C, D), and U-251 MG cells (E, F) following 24 and 48 h of treatment. (G, H) Computerized analysis of the MitoTracker fluorescence intensity in the control versus lactate 18 h after treatment. The figures presented are representative of at least three independent experiments. Values represent the mean ± SEM of experiments performed in quadruplicate. P-values <0.05 were considered as statistically significant (*p < 0.05; **p < 0.01; ***p < 0.001 ; ****p < 0.0001 vs. untreated).

Acknowledgments
This image is the copyrighted work of the attributed author or publisher, and ZFIN has permission only to display this image to its users. Additional permissions should be obtained from the applicable author or publisher of the image. Full text @ Front Oncol