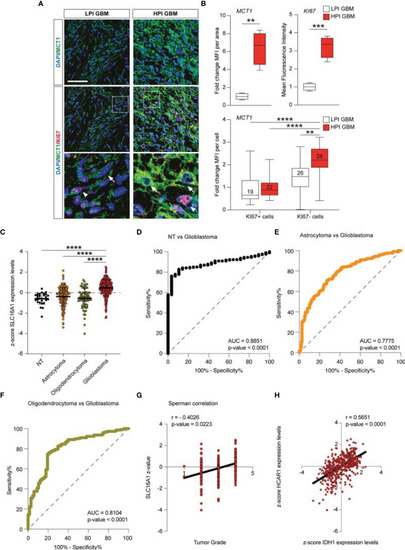
MCT1 expression analysis from the human brain tumor GSE108474 dataset. (A) Analysis of the MCT1 gene expression in brain biopsies of patients with astrocytoma, oligodendrocytoma, and glioblastoma (GBM) and in healthy subjects. (B) Pearson’s correlation analysis between the expression levels of MCT1 and the tumor grade of brain biopsies obtained from patients affected by main brain tumors. (C) Pearson’s correlation between the expression levels of MCT1 and IDH1 in brain biopsies of patients with GBM. (D–F) Receiver operating characteristic (ROC) analysis between the expression levels of MCT1 in the brain in healthy subjects vs. GBM patients (D), between GBM patients vs. astrocytoma patients (E), and between GMB patients vs. oligodendrocytoma patients (F). (G) Sperman correlation of SLC16A1 z-value and tumor grade. (H) Correlation between HCAR1 and IDH1 expression levels. Data are expressed as the mean ± SD of at least four independent experiments (**p < 0.005; ***p < 0.001; ****p < 0.0001)..
|
