
- Title
-
Upregulation of PNCK Promotes Metastasis and Angiogenesis via Activating NF-κB/VEGF Pathway in Nasopharyngeal Carcinoma
- Authors
- Chen, X., Weng, Y., Li, Y., Fu, W., Huang, Z., Pan, Y., Hong, W., Lin, W., Lin, X., Qiu, S.
- Source
- Full text @ J Oncol
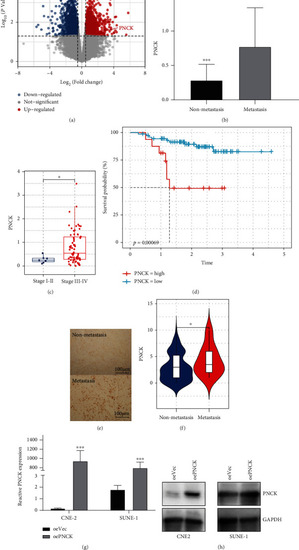
High expression of PNCK in NPC metastatic tissue. (a) The volcanic plot shows the distribution of significantly upregulated or downregulated differentially expressed genes using 5-metastatic and 5-non-metastatic NPC tissue samples; PNCK is among the upregulated genes. (b) Relative expression of PNCK evaluated by mRNA sequencing. (c) GSE102349 cohort indicating the higher PNCK expression in advanced stage (stage III-IV) as compared to the early-stage NPC patients (stage I-II). (d) GSE102349 cohort indicating that the higher PNCK expression is associated with worse PFS. (e) Validation of the PNCK protein expression using paraffin-embedded NPC nonmetastatic and metastatic tissues assessed by immunohistochemistry, and (f) the quantification of PNCK. Student's |
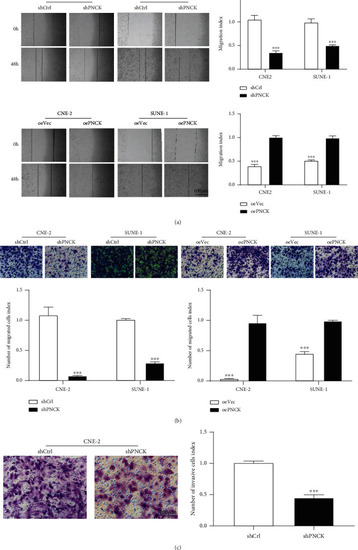
Representative results and quantification of in vitro experiments in generated NPC cell lines with PNCK overexpression (oePNCK) and PNCK knockdown (shPNCK). (a) PNCK knockdown inhibits NPC cell migration distance, while overexpression of PNCK promotes cell migration as seen in wound healing assays. (b, c) PNCK overexpression enhances the invasion and migration potential of NPC cells as assessed by transwell assays. Student's |

Role of PNCK in the in vivo metastasis and angiogenesis model of NPC. (a) Representative images and (b) quantification of lung metastatic foci in mice after injecting SUNE-1 cells with overexpression of PNCK or control vector by tail vein injection. Arrows indicate surface metastatic nodules. (c) Alignment of PNCK amino acid sequences of human and zebrafish. (d) The schematic diagram of RNA-editing technology in the zebrafish embryo. (e) Fluorescence intensity of intersegmental vessels in Tg (fli1a: EGFP) embryos inoculated with blank, control, or PNCK KD vector. ANOVA, ∗∗∗ |
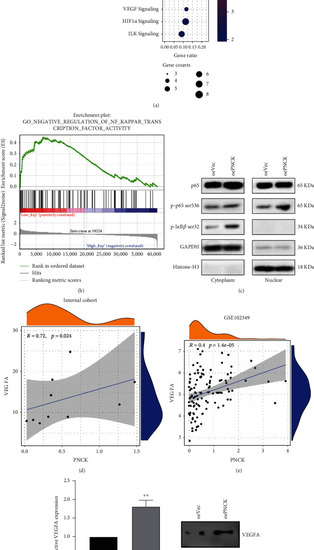
The activity of the NF- |