
|
Figure 1
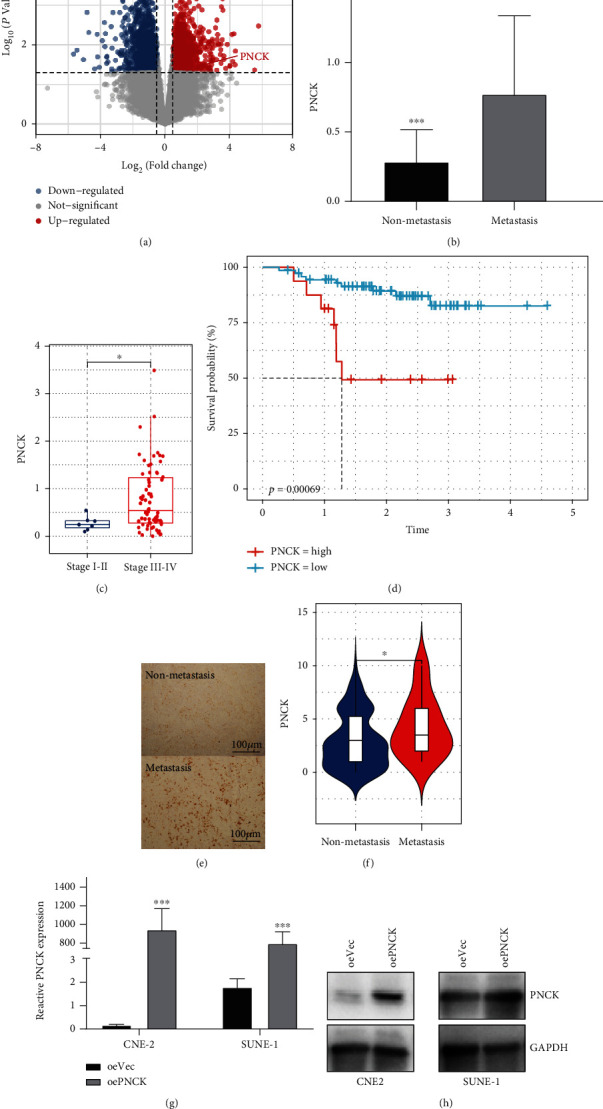
High expression of PNCK in NPC metastatic tissue. (a) The volcanic plot shows the distribution of significantly upregulated or downregulated differentially expressed genes using 5-metastatic and 5-non-metastatic NPC tissue samples; PNCK is among the upregulated genes. (b) Relative expression of PNCK evaluated by mRNA sequencing. (c) GSE102349 cohort indicating the higher PNCK expression in advanced stage (stage III-IV) as compared to the early-stage NPC patients (stage I-II). (d) GSE102349 cohort indicating that the higher PNCK expression is associated with worse PFS. (e) Validation of the PNCK protein expression using paraffin-embedded NPC nonmetastatic and metastatic tissues assessed by immunohistochemistry, and (f) the quantification of PNCK. Student's