
- Title
-
N'-terminal- and Ca2+-induced stabilization of high-order oligomers of full-length Danio rerio and Homo sapiens otolin-1
- Authors
- Bielak, K., Ho?ubowicz, R., Zoglowek, A., ?ak, A., K?dzierski, P., O?yhar, A., Dobryszycki, P.
- Source
- Full text @ Int. J. Biol. Macromol.
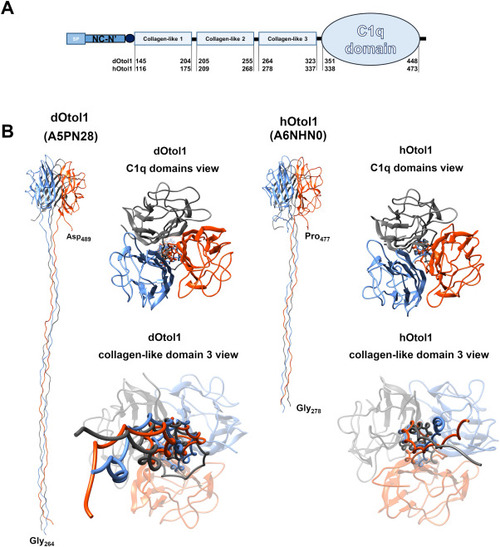
Fig. 1. Schematic representation of the domain-specific structure of otolin-1 based on UniProt data for otolin-1 with identifiers A5PN28 and A6NHN0 (A). Given segments (SP ? signal peptide; NC-N? ? noncollagenous N-terminal domain; central collagen-like domain and C-terminal globular C1q domain) are captioned with amino acid positions in the full primary sequence of the protein. Panel B shows fragments of otolin-1 trimeric structure models composed of the collagen-like domain 3 and C1q domains. |

Fig. 2. Circular dichroism spectra of dOtol1 and hOtol1 in far (A) and near (B) ultraviolet light in buffer F. For far-UV CD spectroscopy, a 10-?M protein concentration was used, while for near-UV CD, the protein concentration was 40 ?M. The internal column graph in A shows the structure content after spectral deconvolution with CDNN 2.1. software. The near-UV CD spectra regions (B) are marked in grey corresponding to signals derived from Trp, Tyr and Phe residues in the range of 285?305 nm, 275?285 nm and 255?270 nm, respectively. |

Fig. 3. Oligomerization of dOtol1 (A) and hOtol1 (B) shown as the continuous sedimentation coefficient distribution at three protein concentrations in buffer F: 0.2 mg/ml, 0.5 mg/ml and 1.0 mg/ml. Panels C and D represent the dOtol1 and hOtol1 sedimentation coefficient distributions in the presence of 2 mM 2-mercaptoethanol (2MeEtOH). |

Fig. 4. The dOtol1 (A and B) and hOtol1 (C and D) crosslinking assays were examined by SDS-PAGE and Western blotting. |

Fig. 5. Negative stain transmission electron microscope images of dOtol1 (A) and hOtol1 (B) oligomers with magnified selected structures shown in squares below (side length of a square corresponds to 35 nm). |
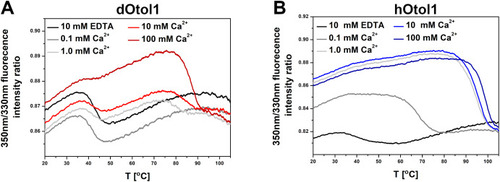
Fig. 6. Thermal denaturation curves of 4 ?M dOtol1 (A) and hOtol1 (B) in buffer F supplemented with 10 mM EDTA or a range of Ca2+ concentrations performed with nanoDSF. |

Fig. 7. CD spectra of 10 ?M dOtol1 (A) and hOtol1 (B) recorded in buffer F supplemented with 10 mM EDTA or 1.0, 10 and 100 mM Ca2+ concentrations. |
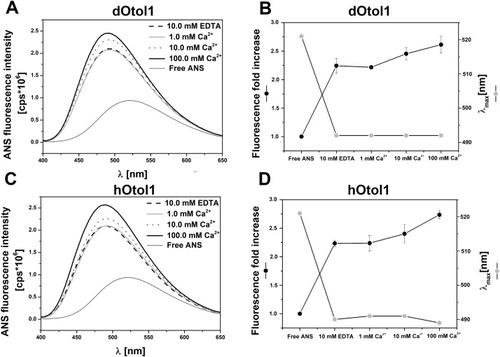
Fig. 8. Fluorescence emission spectra recorded for the ANS probe with 2 ?M dOtol1 (A) or hOtol1 (C) in the absence or presence of Ca2+ excited at 351 nm. The changes in the fluorescence increase and maximal intensity wavelength upon ANS binding to dOtol1 and hOtol1 are shown in B and D, respectively. |
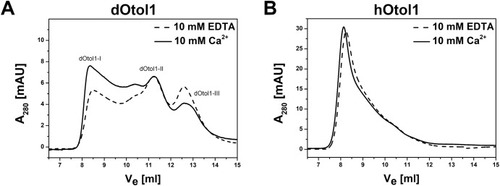
Fig. 9. The chromatograms of aSEC of 100 ?L (0.5 mg/ml) dOtol1 (A) and hOtol1 (B) in the presence of 10 mM EDTA or 10 mM Ca2+ in buffer E. |
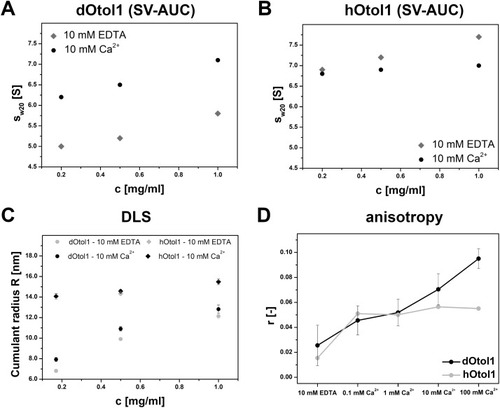
Fig. 10. The changes in derived from AUC of 0.2 mg/ml, 0.5 mg/ml and 1.0 mg/ml concentrations of dOtol1 (A) and hOtol1 (B) in the presence of 10 mM EDTA or 10 mM Ca2+. The sedimentation profile is shown in Fig. S4. Panel C represents the dependence of the cumulative radius of dOtol1 and hOtol1 on protein concentration and Ca2+ presence estimated with DLS. The fluorescence anisotropy values of ATTO-488-labelled dOtol1 and hOtol1 at increasing Ca2+ concentrations are shown in Panel D. |
Reprinted from International journal of biological macromolecules, 209(Pt A), Bielak, K., Ho?ubowicz, R., Zoglowek, A., ?ak, A., K?dzierski, P., O?yhar, A., Dobryszycki, P., N'-terminal- and Ca2+-induced stabilization of high-order oligomers of full-length Danio rerio and Homo sapiens otolin-1, 1032-1047, Copyright (2022) with permission from Elsevier. Full text @ Int. J. Biol. Macromol.